
|
Figure 4
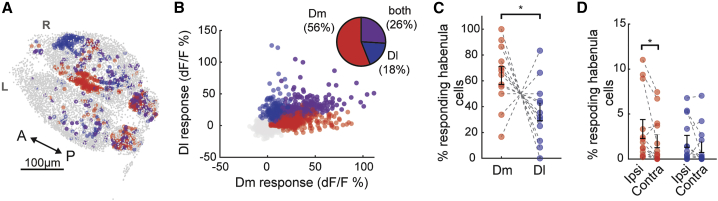
Activating Dm and Dl recruits partially overlapping but different sets of habenular neurons
(A) Representative example of three-dimensional forebrain reconstruction in
(B) Responses of 8,703 individual habenular neurons to Dm (red) and Dl (blue) stimulation or both (magenta) in 12 experiments. Pie chart represents the ratio of habenular neurons responding at least one stimulation, 2 SDs above baseline levels.
(C) Fraction of responding habenular neurons (above 2 SDs) activated by Dm (red) and Dl (blue) stimulations in the same brain explant, n = 12. Note that significantly lager fraction of habenular neurons responds to Dm stimulation compared to Dl stimulation (∗p < 0.05, tailed Wilcoxon signed-rank test).
(D) Ratio of neurons in each habenular hemisphere activated by the stimulation of Dm (red) and Dl (blue) regions that are located in ipsilateral versus contralateral hemispheres. While Dm stimulation recruits a significantly larger fraction of neurons in ipsilateral hemisphere, Dl stimulation recruits a similar fraction of neurons in both habenular hemispheres (∗p < 0.05, tailed Wilcoxon signed-rank test).
See also