
Figure 1
- ID
- ZDB-FIG-210925-27
- Publication
- Bartoszek et al., 2021 - Ongoing habenular activity is driven by forebrain networks and modulated by olfactory stimuli
- Other Figures
- All Figure Page
- Back to All Figure Page
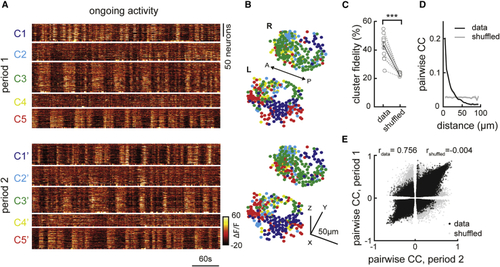
Ongoing activity of habenular neurons is temporally and spatially organized (A) Representative example of ongoing habenular activity recorded by two-photon calcium imaging in (B) Representative example of three-dimensional reconstruction of habenular neurons clustered using k-means clustering in two consecutive time periods (top and bottom). Neurons are color-coded based on their cluster identity that corresponds to the calcium signals depicted in (A). L, left; R, right hemisphere; A, anterior; P, posterior. (C) The ratio of habenular neuron pairs remaining in the same functional clusters (high cluster fidelity) is significantly higher than chance levels during two different time periods of ongoing activity. 315 ± 35 (mean ± SEM) habenular neurons were imaged in each fish (n = 11 fish). ∗∗∗p < 0.001, Wilcoxon signed-rank test. (D) Relation between pairwise correlation of habenular neurons during ongoing activity and the distance between each neuron pair. Gray line represents shuffled spatial distributions. (E) Pairwise correlations of calcium traces of habenular neurons (p < 0.05) during two consecutive time periods, in black. Gray dots represent pairwise comparison shuffled for pair identities. Actual data exhibit a correlation of rdata = 0.756 for the pairwise correlation across two time periods, indicating robust synchrony between pairs of neurons. Shuffled distribution is rs = −0.004. See also |