
Figure 6
- ID
- ZDB-FIG-210925-34
- Publication
- Bartoszek et al., 2021 - Ongoing habenular activity is driven by forebrain networks and modulated by olfactory stimuli
- Other Figures
- All Figure Page
- Back to All Figure Page
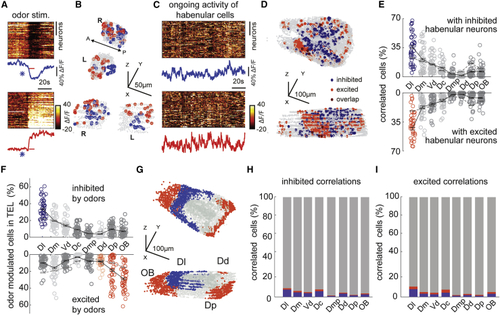
Odor-modulated habenular neurons are functionally connected with limbic dorsal forebrain regions during ongoing activity (A) Representative example of habenular responses to the odor stimulation recorded by two-photon calcium imaging in (B) Representative example of three-dimensional reconstruction of top 5% odor inhibited (blue) and excited (red) habenular neurons from an individual fish. 916 ± 39 (mean ± SEM) habenular neurons were imaged in n = 10 fish. (C) Ongoing neural activity of odor-inhibited (top) and odor-excited (bottom) habenular neurons in (B). Lines represent the average ongoing activity of odor-inhibited (blue) and odor-excited (red) habenular neurons. (D) Representative example of three-dimensional reconstruction of top 5% forebrain neurons that are correlated with the ongoing activity of odor-inhibited (blue) and odor-excited (red) habenular neurons. 5,799 ± 165 (mean ± SEM) forebrain neurons were imaged in n = 10 fish. (E) Anatomical distribution of forebrain neurons with strong correlations (top 5%) to ongoing activity of habenular neurons that are inhibited (top) and excited (bottom) by odors. Red and blue colored circles highlight those forebrain regions that exhibit significantly higher synchrony to habenular neurons than the shuffled chance levels dictated by the size of individual regions. p < 0.01, Wilcoxon signed-rank test. Black lines represent mean ± SEM (n = 10 fish). Dl, dorsolateral telencephalon; Dd, dorsal nucleus of the dorsal telencephalon; Dm, dorsomedial telencephalon; Dp, posterior zone of the dorsal telencephalon; Vd, dorsal nucleus of the ventral telencephalon; OB, olfactory bulb; Dmp, posterior nucleus of dorsomedial telencephalon; Dc, central zone of the dorsal telencephalon. (F) Anatomical distribution of forebrain neurons that are most (top 5%) inhibited (top) and most excited (bottom) by odors. Colored circles highlight those forebrain regions that exhibit significantly higher number of odor-inhibited (blue) and odor-excited (red) neurons than the shuffled chance levels dictated by the size of individual regions. p < 0.01, Wilcoxon signed-rank test. Black lines represent mean ± SEM (n = 10 fish). Dl, dorsolateral telencephalon; Dd, dorsal nucleus of the dorsal telencephalon; Dm, dorsomedial telencephalon; Dp, posterior zone of the dorsal telencephalon; Vd, dorsal nucleus of the ventral telencephalon; OB, olfactory bulb; Dmp, posterior nucleus of dorsomedial telencephalon; Dc, central zone of the dorsal telencephalon. (G) Three-dimensional representation of forebrain regions that show significantly higher number of odor-inhibited (blue) and odor-excited (red) neurons than the shuffled chance levels dictated by the size of individual regions as in (F). Dl, dorsolateral telencephalon; Dd, dorsal nucleus of the dorsal telencephalon; Dp, posterior zone of the dorsal telencephalon; OB, olfactory bulb. (H) Overlap of odor-responding (blue, inhibited; red, excited) neurons in each forebrain region and forebrain neurons that drive odor-inhibited habenular neurons. (I) Overlap of odor-responding (blue, inhibited; red, excited) neurons in each forebrain region and forebrain neurons that drive odor-excited habenular neurons. See also |