
Figure 3
- ID
- ZDB-FIG-210925-31
- Publication
- Bartoszek et al., 2021 - Ongoing habenular activity is driven by forebrain networks and modulated by olfactory stimuli
- Other Figures
- All Figure Page
- Back to All Figure Page
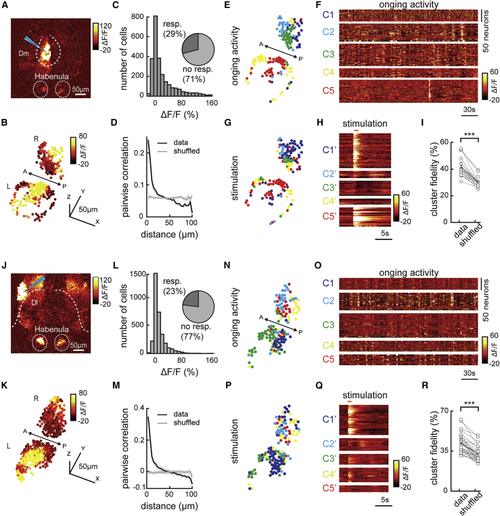
Electrical micro-stimulation of forebrain regions Dm and Dl activates spatially organized clusters of habenular neurons (A) Two-photon calcium signals upon electrical micro-stimulation of forebrain region Dm in (B) Reconstruction of habenular responses upon Dm micro-stimulation. (C) Histogram representing the responses of habenular neurons upon Dm micro-stimulation (511 ± 72 neurons per fish, in n = 5 fish). Pie chart represents the ratio of habenular neurons that are activated 2 SDs higher than baseline levels upon Dm micro-stimulation. (D) Relation between pairwise correlation of habenular neuron responses upon Dm micro-stimulation and the distance between each neuron pair. Gray line represents shuffled spatial distribution. (E) Reconstruction of habenular neurons clustered with k-means functional clustering of their ongoing activity in juvenile zebrafish brain explant. Colors represent habenular clusters with similar ongoing activity. Scale bar represents 50 μm. L, left; R, right hemisphere. (F) Ongoing activity of the habenular neurons corresponding to clusters in (E). (G) Reconstruction of habenular neurons clustered during Dm micro-stimulation using k-means clustering. Colors represent habenular clusters with similar responses to Dm micro-stimulation. L, left; R, right hemisphere. (H) Responses of habenular neurons upon Dm micro-stimulation clustered by k-means clustering. Forebrain micro-stimulations are marked in red. Warm colors represent higher neural activity. (I) The ratio of habenular neuron pairs remaining in the same functional clusters (high cluster fidelity) is significantly higher than chance levels during ongoing activity and Dm micro-stimulation. ∗∗∗p < 0.001, Wilcoxon signed-rank test. (J) Two-photon calcium signals upon electrical micro-stimulation of forebrain region Dl in (K) Reconstruction of habenular responses upon Dl micro-stimulation. (L) Histogram representing the responses of habenular neurons upon Dl micro-stimulation (575 ± 92 neurons per fish, in n = 6 fish). Pie chart represents the ratio of habenular neurons that are activated 2 SDs higher than baseline levels upon Dl micro-stimulation. (M) Relation between pairwise correlation of habenular neuron responses upon Dl micro-stimulation and the distance between each neuron pair. Gray line represents shuffled spatial distribution. (N) Reconstruction of habenular neurons clustered with k-means functional clustering of their ongoing activity in juvenile zebrafish brain explant. Colors represent habenular clusters with similar ongoing activity. L, left; R, right hemisphere. (O) Ongoing activity of the habenular neurons corresponding to clusters in (N). (P) Reconstruction of habenular neurons clustered during Dl micro-stimulation using k-means clustering. Colors represent habenular clusters with similar responses to Dl micro-stimulation. L, left; R, right hemisphere. (Q) Responses of habenular neurons upon Dl micro-stimulation clustered by k-means clustering. Forebrain micro-stimulations are marked in red. (R) The ratio of habenular neuron pairs remaining in the same functional clusters (high cluster fidelity) is significantly higher than chance levels during ongoing activity and Dl micro-stimulation. ∗∗∗p < 0.001, Wilcoxon signed-rank test. See also |