
Figure 2
- ID
- ZDB-FIG-210925-28
- Publication
- Bartoszek et al., 2021 - Ongoing habenular activity is driven by forebrain networks and modulated by olfactory stimuli
- Other Figures
- All Figure Page
- Back to All Figure Page
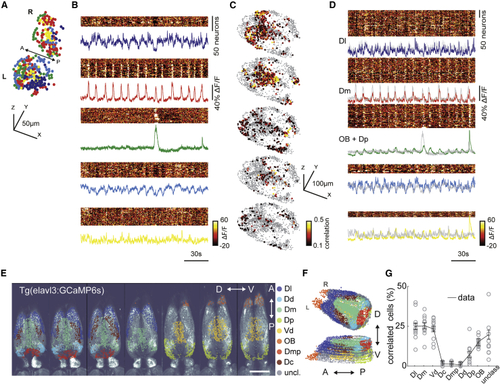
Ongoing activity of habenular neurons is correlated with sensory and limbic forebrain regions (A) Three-dimensional reconstruction of habenular neurons detected in (B) Ongoing activity of the habenular neurons corresponding to clusters in (A). Warm colors represent higher neural activity. Color-coded traces represent the average activity of all neurons in each cluster. (C) Three-dimensional reconstruction of forebrain neurons that are strongly correlated (Pearson’s correlation > 0.1) to average ongoing activity of different habenular clusters in (B). Warm colors represent stronger correlations. 2,135 ± 345 (mean ± SEM) forebrain neurons were imaged in each fish (n = 11 fish). (D) Ongoing activity of the forebrain neurons corresponding to clusters of neurons depicted in (C). Color-coded traces represent the average activity of neurons in each cluster. Gray traces represent the average activity of habenular clusters in (B). Note that the ongoing activity of identified forebrain neurons and habenular clusters is highly similar. (E) Forebrain regions identified based on anatomical landmarks are color coded and overlaid on raw two-photon microscopy image. Scale bar represents 100 μm. Optical planes are shown from dorsal to ventral. A, anterior; P, posterior; D, dorsal; V, ventral. (F) Three-dimensional reconstruction of forebrain regions shown in (E). (G) Distribution of forebrain neurons with strong correlation (>0.1) to ongoing habenular activity into anatomically identified forebrain regions. Dl, dorsolateral telencephalon; Dd, dorsal nucleus of the dorsal telencephalon; Dm, dorsomedial telencephalon; Dp, posterior zone of the dorsal telencephalon; Vd, dorsal nucleus of the ventral telencephalon; OB, olfactory bulb; Dmp, posterior nucleus of dorsomedial telencephalon; Dc, central zone of the dorsal telencephalon; unclass, unclassified. Black lines represent mean ± SEM (n = 11 fish). Each fish is presented as an open circle. Number of neurons detected in each brain region: Dl, 230 ± 35; Dd, 55 ± 9; Dm, 213 ± 33; Dp, 155 ± 24; Vd, 260 ± 40; OB, 273 ± 42; Dmp, 76 ± 12; Dc, 111 ± 17; unclassified, 774 ± 120; mean ± SEM. See also |