
- Title
-
Vesicular monoamine transporter 2 (SLC18A2) regulates monoamine turnover and brain development in zebrafish
- Authors
- Baronio, D., Chen, Y.C., Decker, A.R., Enckell, L., Fernández-López, B., Semenova, S., Puttonen, H.A.J., Cornell, R.A., Panula, P.
- Source
- Full text @ Acta Physiol. (Oxf).
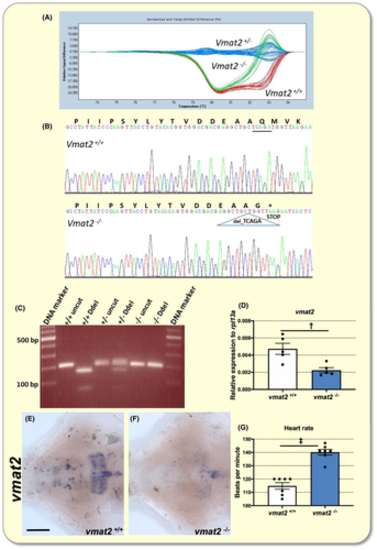
Vmat2 mutants. A, Results of the HRM analysis showing the distinctive melting curves of each genotype. B, Sequencing chromatograms of tail-clipped DNA showing the sequence and the newly generated stop codon of a vmat2−/− zebrafish. C, Identification of genotypes by restriction digestion of PCR products. D, Bar charts showing results of reverse transcription-quantitative PCR (RT-qPCR) analysis on larvae of the indicated genotype at 6 dpf. Vmat2−/− larvae exhibit 60% less vmat2 transcript than vmat2+/+ larvae. E and F, Ventral views of whole-mount 6 dpf larval brains, anterior to the left, processed for vmat2 RNA in situ hybridisation (ISH). Vmat2 expression was clearly lower in mutants than in vmat2+/+ larvae. Scale bar = 75 µm. n = 5 for each genotype. G, Bar chart showing heart rate in larvae of the indicated genotype at 6 dpf. n = 7 for each genotype. The heart rate was lower in mutants than in vmat2+/+ siblings. Data are mean ± SEM. Student's t test was used for statistical analysis. †P < .01. ‡P < .001
|
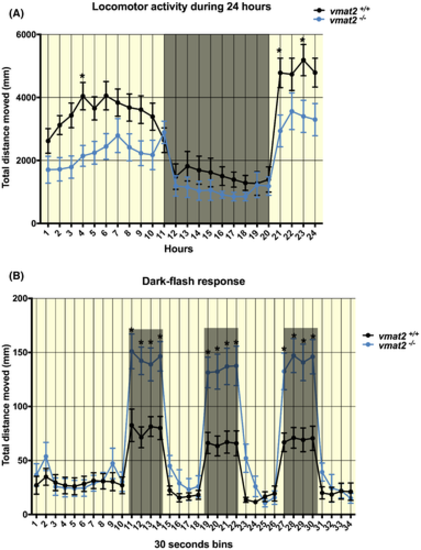
Behavioural evaluation of vmat2+/+ and vmat2−/− zebrafish larvae at 6 dpf. A, vmat2−/− larvae were hypoactive during diurnal and nocturnal (grey shaded area) locomotor activity tracking. B, Larvae were exposed to alternating 2 min periods of light and darkness (grey shaded areas), with three periods of darkness in total. Vmat2−/− larvae were significantly more active than the vmat2+/+ group during all periods of darkness. In panels a and b, n = 16 for each genotype. Data are mean ± SEM. Two-way multiple comparisons ANOVA followed by Sidak's post hoc test was used for statistical analysis. *P < .05
PHENOTYPE:
|
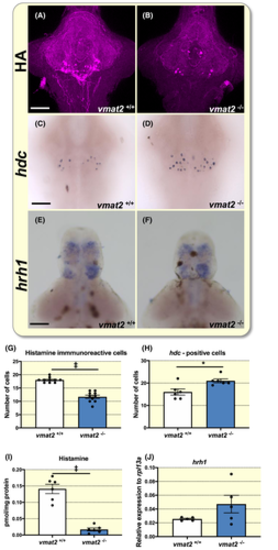
The histaminergic system. A and B, Ventral views of whole-mount 6 dpf larval brains, anterior to the top, processed for histamine (HA) immunostaining. Histamine-immunoreactive neurons in the posterior hypothalamus with descending and ascending fibre projections in the brain of a vmat2+/+ larva and decreased immunoreactive to histamine in the hypothalamus of a vmat2−/− larva. Scale bar = 75 µm. C and D, Ventral views of whole-mount 6 dpf larval brains, anterior to the top, processed for hdc RNA in situ hybridisation (ISH). Scale bar = 75 µm. E and F, Dorsal views of whole-mount 6 dpf larval brains, anterior to the top, processed for hrh1 RNA in situ hybridisation (ISH). n= 5 for each genotype. Scale bar = 75 µm. G, Bar chart showing results of histamine-immunoreactive cells counting on larval brains of the indicated genotype at 6 dpf. The number of histaminergic neurons was significantly reduced in the vmat2−/− brains. n = 10 for each genotype. H, Bar chart showing results of hdc-positive cells counting on larval brains of the indicated genotype. The number of hdc-positive cells was significantly increased in the vmat2−/− brains. n = 6 for each genotype. I, Bar chart showing results of high-performance liquid chromatography (HPLC) assay on larvae of the indicated genotype at 6 dpf. Histamine level was significantly decreased in vmat2−/− larvae. n= 6 for each genotype. J, Bar chart showing results of reverse transcription-quantitative PCR (RT-qPCR) assays on larvae of the indicated genotype at 6 dpf. Vmat2−/− and vmat2+/+ did not show a significant difference in the amount of hrh1 transcript. n= 5 for each genotype. Data are mean ± SEM. Student's t test was used for statistical analysis. *P < .05. ‡P < .001
|
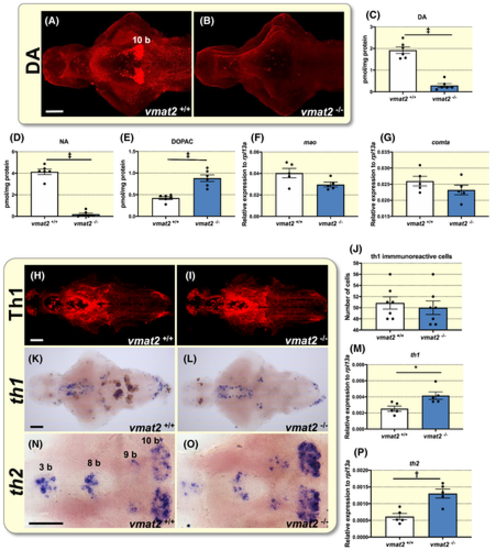
The Catecholaminergic system. A and B, Ventral views of whole-mount 6 dpf larval brains, anterior to the left, processed for dopamine (DA) immunostaining. Dopamine-immunoreactive neurons are present in the diencephalon and telencephalon with extensive descending and ascending fibre networks in the vmat2+/+ larval brain, but only scattered dopamine-immunoreactive neuronal cell bodies are visible in the vmat2−/− larval brain. Scale bar = 75 µm. C-E, Bar chart showing results of high-performance liquid chromatography (HPLC) assay on larvae of the indicated genotype at 6 dpf. Levels of dopamine (DA), noradrenaline (NA) and DOPAC. n = 6 for each genotype. F and G, Bar charts showing results of reverse transcription-quantitative PCR (RT-qPCR) assays on larvae of the indicated genotype at 6 dpf. Vmat2+/+ and vmat2−/− larvae presented similar levels of comta and mao transcripts. n= 5 for each genotype. H and I, Ventral views of whole-mount 6 dpf larval brains, anterior to the left, processed for tyrosine hydroxylase (Th1) immunostaining. Scale bar = 75 µm. J, Bar chart showing results of Th1-immunoreactive cells counting on larval brains of the indicated genotype at 6 dpf. n = 7 for each genotype. K and L, Ventral views of whole-mount 6 dpf larval brains, anterior to the left, processed for tyrosine hydroxylase (th1) RNA in situ hybridisation (ISH). Diencephalic neuronal clusters express th1 in vmat2+/+ and vmat2−/− larval brains. Scale bar = 75 µm. M, Bar charts showing results of reverse transcription-quantitative PCR (RT-qPCR) assay on larvae of the indicated genotype at 6 dpf. Vmat2−/− larvae exhibit increased levels of th1 transcript when compared to their vmat2+/+ siblings. n= 5 for each genotype. N and O, Ventral views of whole-mount 6 dpf larval brains, anterior to the left, processed for tyrosine hydroxylase 2 (th2) RNA in situ hybridisation (ISH). Scale bar = 75 µm. P, Bar charts showing results of reverse transcription-quantitative PCR (RT-qPCR) assay on larvae of the indicated genotype at 6 dpf. Vmat2−/− larvae exhibit increased levels of th2 transcript when compared to their vmat2+/+ siblings. n= 5 for each genotype. Data are mean ± SEM. Student's t test was used for statistical analysis. *P < .05. †P < .01. ‡P < .001
|
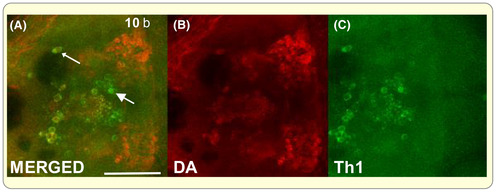
Dopamine and th1 immunoreactivity in the hypothalamus of 6 dpf WT Turku zebrafish larvae. A-C, Ventral views of whole-mount 6 dpf larval brains, anterior to the left, processed for dopamine (DA) and tyrosine hydroxylase (Th1) double immunostaining. Sample fixed with a combination of glutaraldehyde and paraformaldehyde to allow visualisation of both dopamine and th1. It is noteworthy that the fixation required for double staining compromised the signal from both antibodies compared with conditions under which both antibodies perform optimally. Most dopamine-containing neurons are seen in the posterior hypothalamic group 10b, which contains very few weakly Th1-immunoreactive neurons. In more rostral neuron groups (arrowheads) both Th1 and dopamine are seen, and some neurons clearly contain both markers (small arrows). Scale bar = 75 µm
EXPRESSION / LABELING:
|
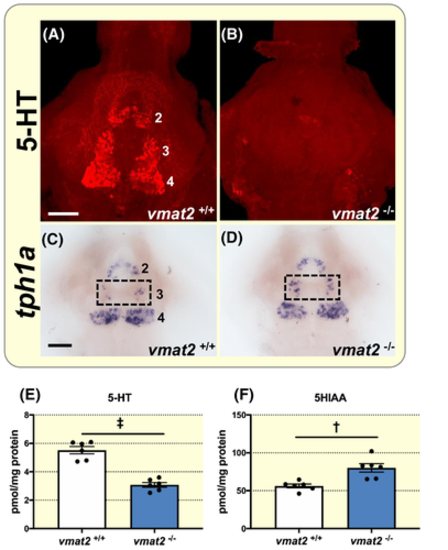
The serotonergic system. A and B, Ventral views of whole-mount 6 dpf larval brains, anterior to the top, processed for serotonin (5-HT) immunostaining. 5-HT immunoreactivity in the brain of a vmat2+/+ larva and clear depletion of 5-HT immunoreactive neurons on its vmat2−/− sibling brain. Scale bar = 75 µm. C and D, Ventral views of whole-mount 6 dpf larval brains, anterior to the top, processed for tph1a RNA in situ hybridisation (ISH). More tph1a-positive neurons are seen in the hypothalamus of a vmat2−/− larva than in vmat2+/+ sibling, particularly on group 3 (dashed box). Scale bar = 75 µm. E and F, Bar chart showing results of high-performance liquid chromatography (HPLC) assay on larvae of the indicated genotype at 6 dpf. Levels of 5-HT and 5HIAA in 6 dpf vmat2+/+ and vmat2−/− larvae. n = 6 for each genotype. Data are mean ± SEM. Student's t test was used for statistical analysis. †P < .01. ‡P < .001
|
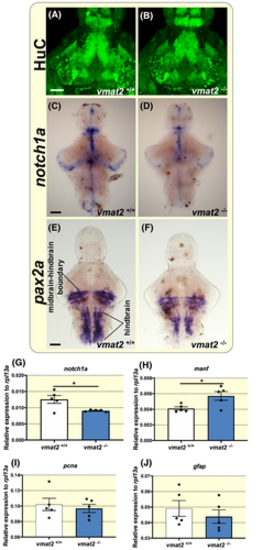
Developmental markers. A and B, Ventral views of whole-mount 6 dpf larval brains, anterior to the top, processed for HuC immunostaining. Vmat2−/− larval brain displays a similar HuC expression pattern relative to vmat2+/+ larval brain. Scale bar = 75 µm. C and D, Ventral views of whole-mount 8 dpf larval brains, anterior to the top, processed for notch1a RNA in situ hybridisation (ISH). A weaker signal is seen in the brain of vmat2−/− larva relative to vmat2+/+ larval brain. Scale bar = 75 µm. E and F, Dorsal views of whole-mount 6 dpf larval brains, anterior to the top, processed for pax2a RNA in situ hybridisation (ISH). Vmat2−/− larval brain displays a clearly weaker signal in the midbrain and hindbrain relative to vmat2+/+ larval brain. Scale bar = 75 µm. G-J, Bar charts showing results of reverse transcription-quantitative PCR (RT-qPCR) assays on larvae of the indicated genotype at 6 dpf. A significant decrease in the expression of notch1a and upregulation of manf transcripts were detected in vmat2−/− larvae when compared to vmat2+/+ siblings. No differences between genotypes were detected when pcna and gfap were measured. n = 5 for each genotype. Data are mean ± SEM. Student's t test was used for statistical analysis. *P < .05
|