
IMAGE
Fig. 7
Image
|
Figure Caption
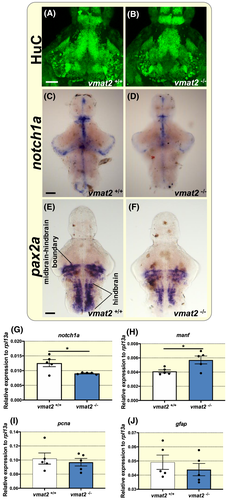
Fig. 7
Developmental markers. A and B, Ventral views of whole-mount 6 dpf larval brains, anterior to the top, processed for HuC immunostaining. Vmat2−/− larval brain displays a similar HuC expression pattern relative to vmat2+/+ larval brain. Scale bar = 75 µm. C and D, Ventral views of whole-mount 8 dpf larval brains, anterior to the top, processed for notch1a RNA in situ hybridisation (ISH). A weaker signal is seen in the brain of vmat2−/− larva relative to vmat2+/+ larval brain. Scale bar = 75 µm. E and F, Dorsal views of whole-mount 6 dpf larval brains, anterior to the top, processed for pax2a RNA in situ hybridisation (ISH). Vmat2−/− larval brain displays a clearly weaker signal in the midbrain and hindbrain relative to vmat2+/+ larval brain. Scale bar = 75 µm. G-J, Bar charts showing results of reverse transcription-quantitative PCR (RT-qPCR) assays on larvae of the indicated genotype at 6 dpf. A significant decrease in the expression of notch1a and upregulation of manf transcripts were detected in vmat2−/− larvae when compared to vmat2+/+ siblings. No differences between genotypes were detected when pcna and gfap were measured. n = 5 for each genotype. Data are mean ± SEM. Student's t test was used for statistical analysis. *P < .05
Figure Data
Acknowledgments
This image is the copyrighted work of the attributed author or publisher, and
ZFIN has permission only to display this image to its users.
Additional permissions should be obtained from the applicable author or publisher of the image.
Full text @ Acta Physiol. (Oxf).