
IMAGE
Fig. 4
Image
|
Figure Caption
Fig. 4
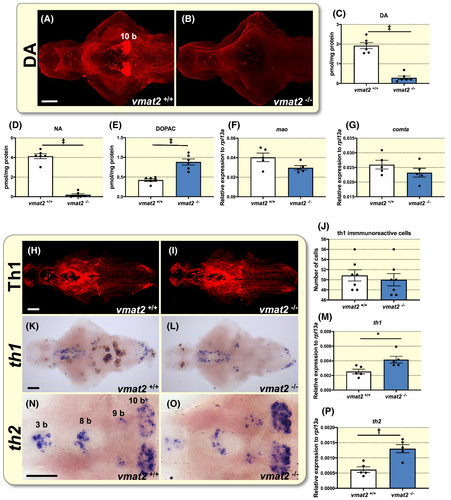
The Catecholaminergic system. A and B, Ventral views of whole-mount 6 dpf larval brains, anterior to the left, processed for dopamine (DA) immunostaining. Dopamine-immunoreactive neurons are present in the diencephalon and telencephalon with extensive descending and ascending fibre networks in the vmat2+/+ larval brain, but only scattered dopamine-immunoreactive neuronal cell bodies are visible in the vmat2−/− larval brain. Scale bar = 75 µm. C-E, Bar chart showing results of high-performance liquid chromatography (HPLC) assay on larvae of the indicated genotype at 6 dpf. Levels of dopamine (DA), noradrenaline (NA) and DOPAC. n = 6 for each genotype. F and G, Bar charts showing results of reverse transcription-quantitative PCR (RT-qPCR) assays on larvae of the indicated genotype at 6 dpf. Vmat2+/+ and vmat2−/− larvae presented similar levels of comta and mao transcripts. n= 5 for each genotype. H and I, Ventral views of whole-mount 6 dpf larval brains, anterior to the left, processed for tyrosine hydroxylase (Th1) immunostaining. Scale bar = 75 µm. J, Bar chart showing results of Th1-immunoreactive cells counting on larval brains of the indicated genotype at 6 dpf. n = 7 for each genotype. K and L, Ventral views of whole-mount 6 dpf larval brains, anterior to the left, processed for tyrosine hydroxylase (th1) RNA in situ hybridisation (ISH). Diencephalic neuronal clusters express th1 in vmat2+/+ and vmat2−/− larval brains. Scale bar = 75 µm. M, Bar charts showing results of reverse transcription-quantitative PCR (RT-qPCR) assay on larvae of the indicated genotype at 6 dpf. Vmat2−/− larvae exhibit increased levels of th1 transcript when compared to their vmat2+/+ siblings. n= 5 for each genotype. N and O, Ventral views of whole-mount 6 dpf larval brains, anterior to the left, processed for tyrosine hydroxylase 2 (th2) RNA in situ hybridisation (ISH). Scale bar = 75 µm. P, Bar charts showing results of reverse transcription-quantitative PCR (RT-qPCR) assay on larvae of the indicated genotype at 6 dpf. Vmat2−/− larvae exhibit increased levels of th2 transcript when compared to their vmat2+/+ siblings. n= 5 for each genotype. Data are mean ± SEM. Student's t test was used for statistical analysis. *P < .05. †P < .01. ‡P < .001
Figure Data
Acknowledgments
This image is the copyrighted work of the attributed author or publisher, and
ZFIN has permission only to display this image to its users.
Additional permissions should be obtained from the applicable author or publisher of the image.
Full text @ Acta Physiol. (Oxf).