
Image
|
Figure Caption
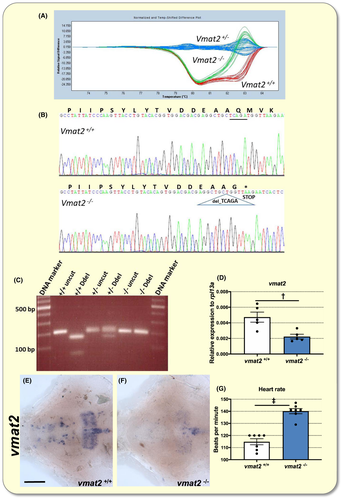
Fig. 1
Vmat2 mutants. A, Results of the HRM analysis showing the distinctive melting curves of each genotype. B, Sequencing chromatograms of tail-clipped DNA showing the sequence and the newly generated stop codon of a vmat2−/− zebrafish. C, Identification of genotypes by restriction digestion of PCR products. D, Bar charts showing results of reverse transcription-quantitative PCR (RT-qPCR) analysis on larvae of the indicated genotype at 6 dpf. Vmat2−/− larvae exhibit 60% less vmat2 transcript than vmat2+/+ larvae. E and F, Ventral views of whole-mount 6 dpf larval brains, anterior to the left, processed for vmat2 RNA in situ hybridisation (ISH). Vmat2 expression was clearly lower in mutants than in vmat2+/+ larvae. Scale bar = 75 µm. n = 5 for each genotype. G, Bar chart showing heart rate in larvae of the indicated genotype at 6 dpf. n = 7 for each genotype. The heart rate was lower in mutants than in vmat2+/+ siblings. Data are mean ± SEM. Student's t test was used for statistical analysis. †P < .01. ‡P < .001
Figure Data
Acknowledgments
This image is the copyrighted work of the attributed author or publisher, and
ZFIN has permission only to display this image to its users.
Additional permissions should be obtained from the applicable author or publisher of the image.
Full text @ Acta Physiol. (Oxf).