
- Title
-
Conservation of Zebrafish MicroRNA-145 and Its Role during Neural Crest Cell Development
- Authors
- Steeman, T.J., Rubiolo, J.A., Sánchez, L.E., Calcaterra, N.B., Weiner, A.M.J.
- Source
- Full text @ Genes (Basel)
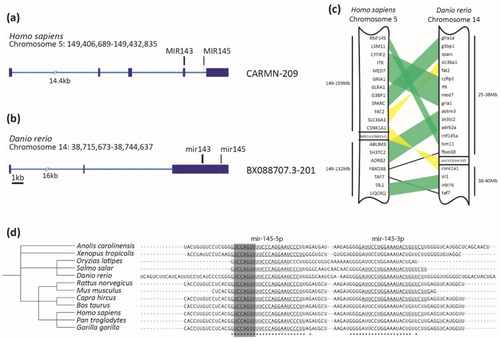
MiR-145 is highly conserved across vertebrates. (a,b) Homo sapiens CARMN-209 and Danio rerio BX088707.3-201 transcripts containing miR-143 (in black) and miR-145 (in gray) precursors. Exons are represented with dark blue boxes and introns with light blue lines. Scale bar represents 1kb. (c) Schematic representation of synteny analysis of miR-143/miR-145 cluster between Homo sapiens and Danio rerio. Blocks of genes in the same order are highlighted in green, while those blocks that are inverted are in yellow. Only conserved genes are shown. (d) Clustal Omega alignment of miR-145 precursor, displaying taxonomic tree on the left and aligned sequences on the right. Asterisks at the bottom represent 100% conserved bases. The mature miR-145-5p sequence is underlined on the left, with the seed sequence highlighted in gray. Some species that also possess annotated mature miR-145-3p are underlined on the right. |
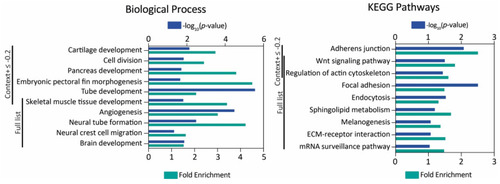
MiR-145 zebrafish target gene analysis. Gene Ontology and KEGG pathway enrichment analysis of genes with context+ score under −0.2 and the full list. The -log10(p-value) and fold enrichment of selected biological process terms (left) and KEGG pathways (right) are shown. |
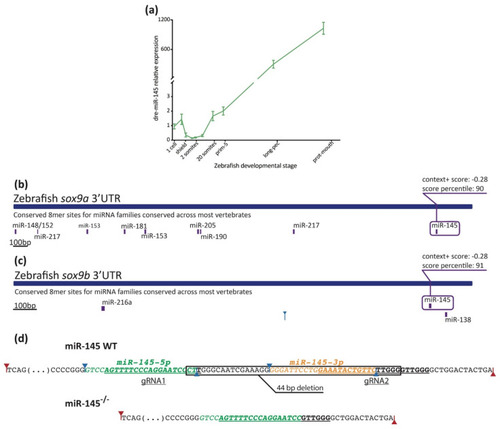
Measurement of miR-145 expression with stem–loop RT-qPCR. (a) MiR-145 temporal expression levels during zebrafish development (±SEM, n = 3). (b,c) Schematic representation of sox9a (ENSDARG00000003293) and sox9b (ENSDARG00000043293) 3′UTR. Putative miRNA binding sites are shown below each region. MiR-145 sites are enclosed in purple boxes, with their respective context+ scores. (d) Schematic representation of miR-145 genomic wild-type sequence (top) and CRISPR/Cas9 mutant sequence (bottom). Mature mir-145-5p and -3p in green and orange, respectively, and underlined gRNA sequences are shown. Drosha and Dicer1 cleavage sites marked with red and blue arrows, respectively. |
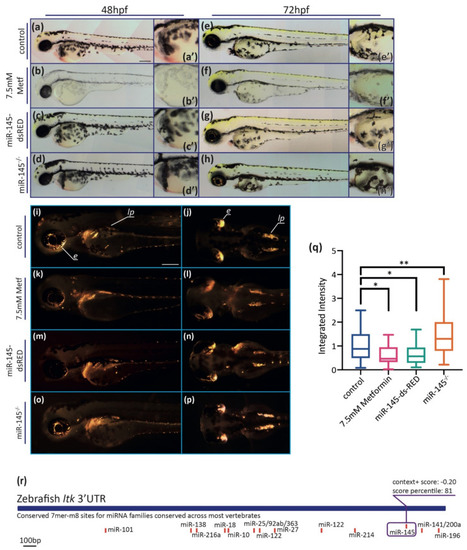
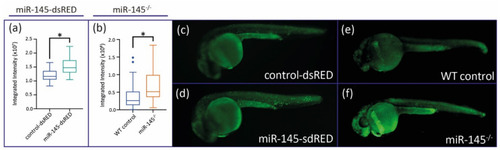
MiR-145 gain- and loss-of-function larvae display pigment developmental phenotypes. (a–h) Representative images of live metformin-treated (b,f) or miR-145-dsRED microinjected (c,g), and miR-145−/− mutant (d,h) larvae and control siblings (a,e). Lateral views with head to the left, dorsal uppermost, of 48 hpf (a–d) and 72 hpf (e–h) specimens. Insets show enlarged regions of the yolk sac (a′–h′) in order to compare melanocyte differentiation phenotype. Scale bar represents 200 μm in A for a-h. (i–p) Incident light images of 3 dpf larvae showing eye and trunk iridophores (silver spots) in wild-type sibling (i,j), and metformin-treated (k,l), miR-145-dsRED microinjected (m,n), and miR-145−/− mutant (o,p) larvae. Pictures in (i,k,m,o) are lateral views while pictures in (j,l,n,p) are dorsal views, head to the left. Scale bar represents 200 μm in (i) for (i–p). (q) Quantification of iridescent light of miR-145-dsRED microinjected, metformin-treated, and miR-145−/− mutant larvae with their corresponding controls at 3 dpf. e: eyes; lp: lateral patches. (±SEM, n = 3, two-tailed Student’s t-test, * p < 0.05; ** p < 0.01). (r): Schematic representation of ltk (ENSDARG00000042681) 3′UTR. Putative miRNA binding sites are shown below each region. MiR-145 site is enclosed in a purple box, with its respective context+ score. |
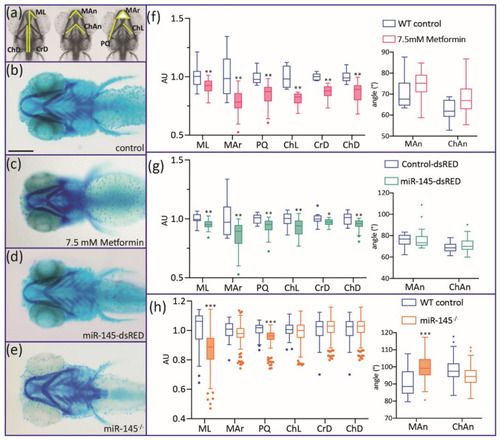
Alcian Blue staining of 5 dpf miR-145-dsRED microinjected, miR-145−/− mutant, and metformin-treated larvae. (a) Different cranial parameters are measured: Mar: Meckel area; ChL: ceratohyal length; PQ: palatoquadrate length; ML: Meckel length; CrD: cranial distance; ChD: ceratohyal-to-fin distance; Man: Meckel angle; ChAn: ceratohyal angle. (b–e) Control (b), metformin-treated (c), miR-145-dsRED microinjected (d), and miR-145−/− mutant (e) larvae. All larvae are positioned ventrally with head to the left. (f–h) Measurement of cranial parameters corresponding to metformin-treated (f), miR-145-dsRED microinjected (g), and miR-145−/− mutant (h) larvae compared with their respective controls (WT siblings not treated with drug, Control-dsRED microinjected, and WT siblings, respectively). Arbitrary units (AU) in the y-axis of length and area graphs result from standardization of measurement data to the control counterpart of each parameter. Statistically different parameters have boxplots shaded for easier identification. Two-tailed Student’s t-test, * p < 0.05, ** p < 0.01, *** p < 0.0001. Scale bar represents 200 μm in (b) for (b–e). |
Apoptosis levels are analyzed in miR-145 gain- and loss-of-function embryos. ( |
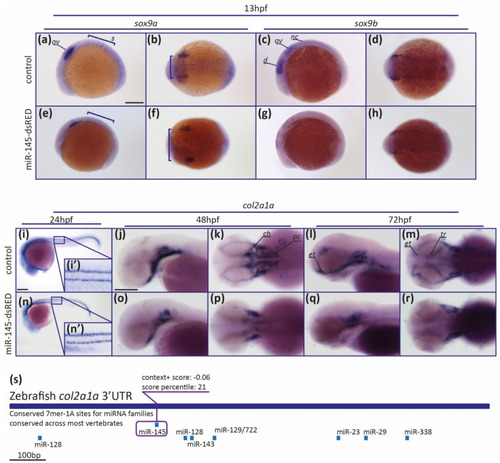
MiR-145 upregulation affects the expression of NCC marker genes. (a–h) Whole-mount in situ hybridization of sox9a (a,b,e,f) and sox9b (c,d,g,h) performed on 13 hpf miR-145-dsRED microinjected embryos. Lateral views are dorsal to top (a,e,c,g); dorsal views are anterior to left (b,f,d,h). In (a) ov: otic vesicle; s: somites. In (c) d: diencephalon; ov: otic vesicle; nc: neural crest. Scale bar represents 200 μm in (a) for (a–h). (i–r) Whole-mount in situ hybridization of col2a1a (ENSDARG00000069093) in miR-145-dsRED microinjected specimens at 24 hpf (i,n), 48 hpf (j,k,o,p), and 72 hpf (l,m,q,r). Lateral and dorsal views are head to left. In (k) ch: ceratohyal; pc: parachordals. In (l,m) et: ethmoid plate; tr: trabeculae. (s) Schematic representation of col2a1a 3′UTR. Putative miRNA binding sites are shown below each region. MiR-145 site is enclosed in a purple box, with its respective context+ score. Scale bars represent 200 μm in (i) for (i,n); and in (j) for (j–m) and (o–r). |
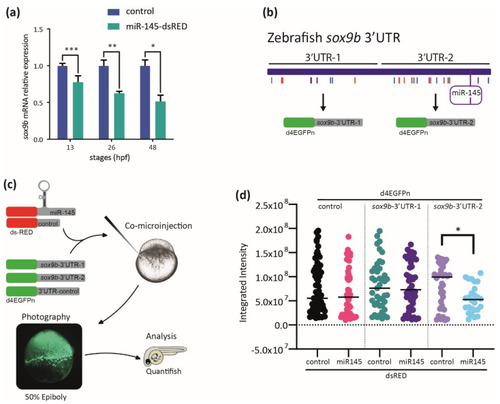
MiR-145 controls sox9b expression. (a) Relative levels of sox9b mRNA in miR-145-dsRED microinjected and control embryos; bars represent values measured at each developmental stage normalized to the amount of the corresponding mRNA measured in controls at 13, 26, 48, and 72 hpf (±S.E.M., n = 4). Two-tailed Student’s t-test, * p = 0.03; ** p = 0.012; *** p = 0.002. (b) Schematic representation of the cloning of sox9b 3′UTR fragments 1 and 2, with putative miRNA sites marked with colored lines and miR-145 enclosed in a purple box. (c) Schematic representation of the experimental strategy followed for the study of dGFP expression. (d) Quantification of dGFP in embryos co-microinjected with miR-145-dsRED or control-dsRED and different 3′UTRs (n = 4). Two-tailed Student’s t-test, * p = 0.006. |