
|
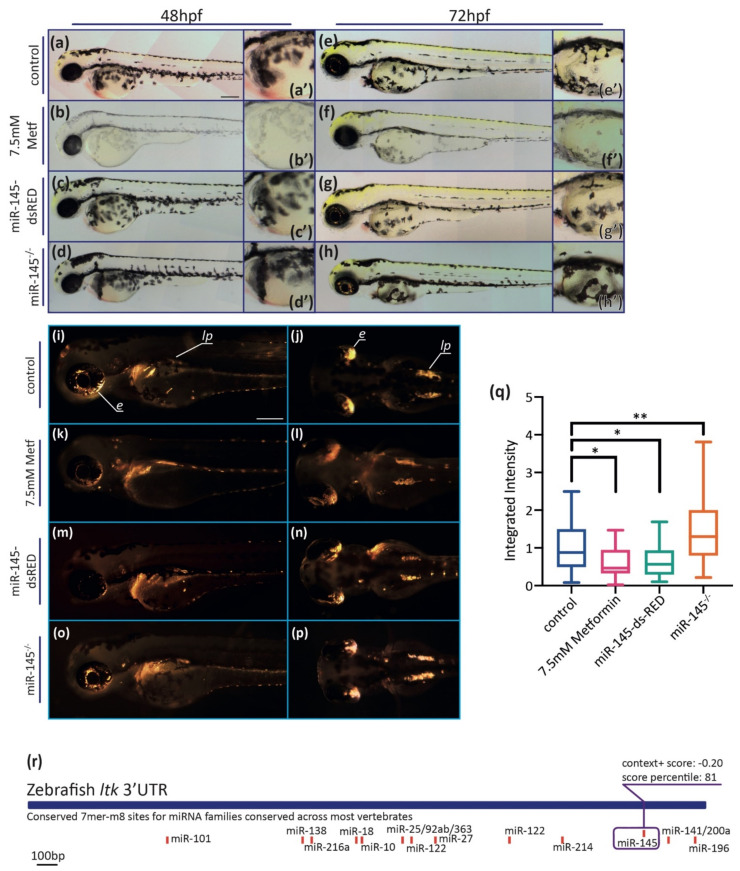
Figure 4 MiR-145 gain- and loss-of-function larvae display pigment developmental phenotypes. (a–h) Representative images of live metformin-treated (b,f) or miR-145-dsRED microinjected (c,g), and miR-145−/− mutant (d,h) larvae and control siblings (a,e). Lateral views with head to the left, dorsal uppermost, of 48 hpf (a–d) and 72 hpf (e–h) specimens. Insets show enlarged regions of the yolk sac (a′–h′) in order to compare melanocyte differentiation phenotype. Scale bar represents 200 μm in A for a-h. (i–p) Incident light images of 3 dpf larvae showing eye and trunk iridophores (silver spots) in wild-type sibling (i,j), and metformin-treated (k,l), miR-145-dsRED microinjected (m,n), and miR-145−/− mutant (o,p) larvae. Pictures in (i,k,m,o) are lateral views while pictures in (j,l,n,p) are dorsal views, head to the left. Scale bar represents 200 μm in (i) for (i–p). (q) Quantification of iridescent light of miR-145-dsRED microinjected, metformin-treated, and miR-145−/− mutant larvae with their corresponding controls at 3 dpf. e: eyes; lp: lateral patches. (±SEM, n = 3, two-tailed Student’s t-test, * p < 0.05; ** p < 0.01). (r): Schematic representation of ltk (ENSDARG00000042681) 3′UTR. Putative miRNA binding sites are shown below each region. MiR-145 site is enclosed in a purple box, with its respective context+ score.