
|
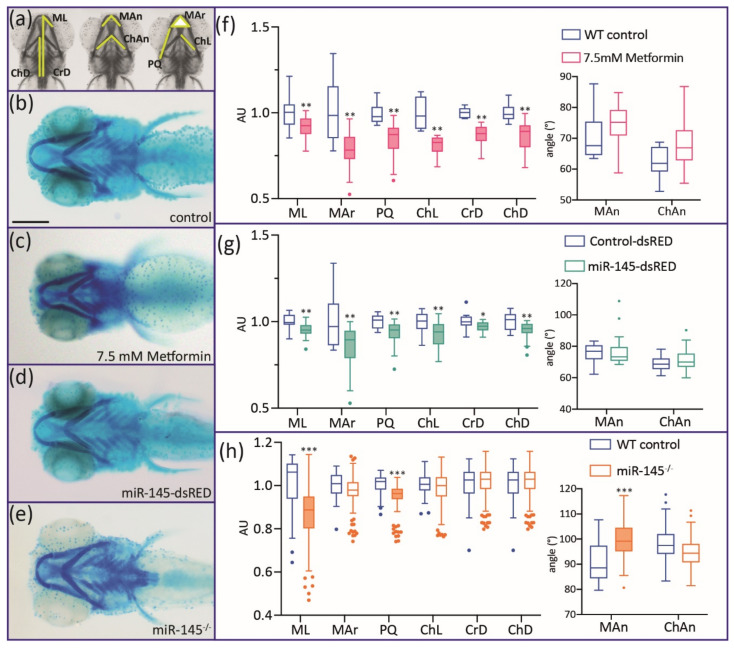
Figure 5 Alcian Blue staining of 5 dpf miR-145-dsRED microinjected, miR-145−/− mutant, and metformin-treated larvae. (a) Different cranial parameters are measured: Mar: Meckel area; ChL: ceratohyal length; PQ: palatoquadrate length; ML: Meckel length; CrD: cranial distance; ChD: ceratohyal-to-fin distance; Man: Meckel angle; ChAn: ceratohyal angle. (b–e) Control (b), metformin-treated (c), miR-145-dsRED microinjected (d), and miR-145−/− mutant (e) larvae. All larvae are positioned ventrally with head to the left. (f–h) Measurement of cranial parameters corresponding to metformin-treated (f), miR-145-dsRED microinjected (g), and miR-145−/− mutant (h) larvae compared with their respective controls (WT siblings not treated with drug, Control-dsRED microinjected, and WT siblings, respectively). Arbitrary units (AU) in the y-axis of length and area graphs result from standardization of measurement data to the control counterpart of each parameter. Statistically different parameters have boxplots shaded for easier identification. Two-tailed Student’s t-test, * p < 0.05, ** p < 0.01, *** p < 0.0001. Scale bar represents 200 μm in (b) for (b–e).