
|
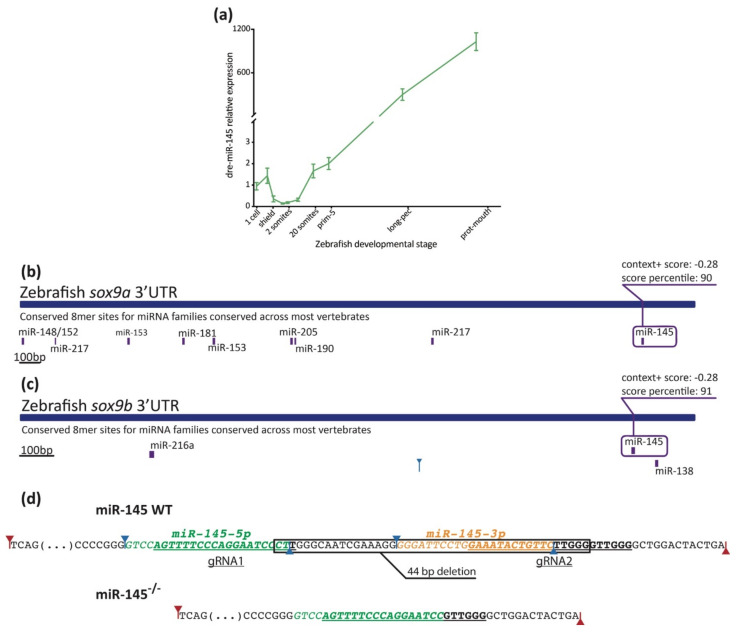
Figure 3 Measurement of miR-145 expression with stem–loop RT-qPCR. (a) MiR-145 temporal expression levels during zebrafish development (±SEM, n = 3). (b,c) Schematic representation of sox9a (ENSDARG00000003293) and sox9b (ENSDARG00000043293) 3′UTR. Putative miRNA binding sites are shown below each region. MiR-145 sites are enclosed in purple boxes, with their respective context+ scores. (d) Schematic representation of miR-145 genomic wild-type sequence (top) and CRISPR/Cas9 mutant sequence (bottom). Mature mir-145-5p and -3p in green and orange, respectively, and underlined gRNA sequences are shown. Drosha and Dicer1 cleavage sites marked with red and blue arrows, respectively.