
|
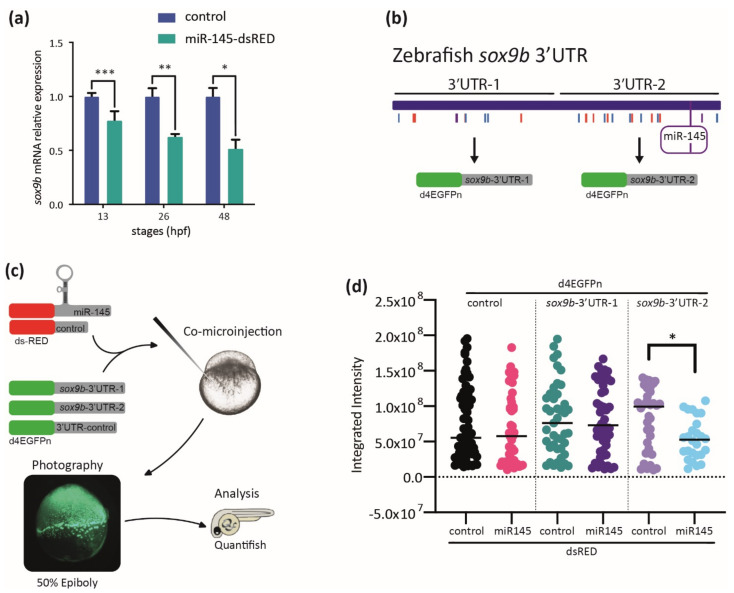
Figure 8 MiR-145 controls sox9b expression. (a) Relative levels of sox9b mRNA in miR-145-dsRED microinjected and control embryos; bars represent values measured at each developmental stage normalized to the amount of the corresponding mRNA measured in controls at 13, 26, 48, and 72 hpf (±S.E.M., n = 4). Two-tailed Student’s t-test, * p = 0.03; ** p = 0.012; *** p = 0.002. (b) Schematic representation of the cloning of sox9b 3′UTR fragments 1 and 2, with putative miRNA sites marked with colored lines and miR-145 enclosed in a purple box. (c) Schematic representation of the experimental strategy followed for the study of dGFP expression. (d) Quantification of dGFP in embryos co-microinjected with miR-145-dsRED or control-dsRED and different 3′UTRs (n = 4). Two-tailed Student’s t-test, * p = 0.006.