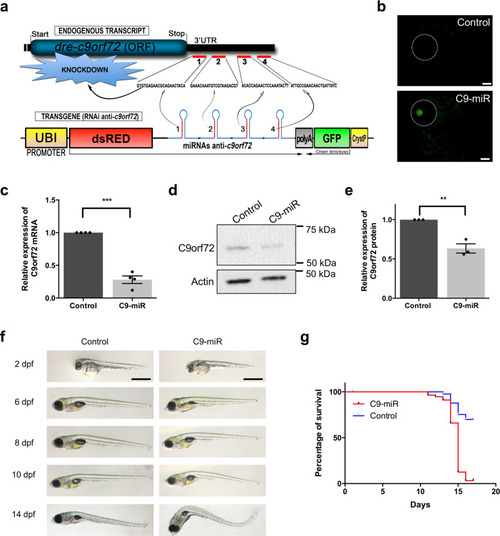
Generation of a stable zebrafish C9orf72 knockdown line.

a Schematic representation of the technique used to silence C9orf72 in zebrafish. The transgene is designed to express four different micro-RNAs targeting C9orf72’s 3’UTR and triggering knockdown by both repressing C9orf72 translation and affecting its stability. b Images demonstrating proper eGFP expression in the crystallin of the transgenic fish, a marker used to identify carrier/knockdown larvae. Scale bar = 100 μm. c Bar graph shows the relative expression of the endogenous C9orf72 gene. mRNA was normalized to elf1α mRNA levels (N = 4, ***p < 0.0001, Student’s t test). d Immunoblotting of the zebrafish protein C9orf72 and beta-actin as control. e Bar graph shows the relative expression of the C9orf72 protein compared with actin between C9orf72 mutants and control line (N = 3; **p = 0.0034; Student’s t test). f Gross morphological analyses of wild-type control and C9orf72-LOF fish (C9-miR). g Kaplan–Meier survival plot over 17 days after fertilization (dpf) showing low survival of C9-miR compared to controls after 10 dpf (N = 3, n = 25). Data are presented as mean ± SEM. n represents the number of fish, N represents the number of experimental repeats.

Motor behavioural deficits and reduced acetylcholine receptor clusters at neuromuscular junctions (NMJs) in C9-miR fish.

a Representative swimming tracks of control, C9-miR and C9-rescue fish at 6 dpf. Scale bar = 0.2 cm. b C9-miR larvae (N = 3, n = 65) displayed impaired swimming compared to controls (N = 3, n = 60; ***p < 0.0001; one-way ANOVA). Expression of the human C9orf72 long transcript in C9-miR fish (C9-rescue; N = 3, n = 53) significantly rescued the motor behavioural defects (***p < 0.0001; one-way ANOVA). c Representative images of co-immunostaining of zebrafish neuromuscular junctions with presynaptic (SV2; green) and postsynaptic (α-bungarotoxin; red) markers in 6 dpf zebrafish. Scale bar = 100 μm. d Quantification of the colocalizing presynaptic and postsynaptic markers per somite showed a significant reduction in the number of puncta in C9-miR fish at 6 dpf that can be rescued with the expression of human C9orf72 mRNA (C9-rescue) (n = 8–10; ***p < 0.0001; one-way ANOVA). Data are presented as mean ± SEM. n represents the number of fish, N represents the number of experimental repeats.

C9-miR zebrafish exhibited attenuated miniature endplate currents (mEPCs) at NMJs.

a Recordings of mEPCs, which result from spontaneous release of a quantum, were recorded in 6 dpf control and C9-miR fish (n = 6). b Representative mEPCs. Animals with reduced C9orf72 (C9-miR) displayed mEPCs with reduced frequency (c) (n = 6–7; ***p < 0.0001; Student’s t test) and amplitude (d) (n = 7; **p < 0.001; Student’s t test). Rise time (e) (n = 7; p = 0.3947; Student’s t test) and decay time (f) constant kinetics of mEPC (n = 7; p = 0.8385; Student’s t test) were not found to be significantly different between controls and C9-miR. Data are presented as mean ± SEM. n represents the number of fish.

C9-miR zebrafish displayed TDP-43 pathology.

a Illustration of 6 dpf zebrafish skeletal muscle cells with large nuclei labelled with muscle marker, phalloidin, and nucleus marker, Hoechst. b Representative images of 6 dpf zebrafish skeletal muscle cells for TDP-43. Compared to control fish, we observed cytoplasmic clustering of TDP-43 expression in the C9-miR skeletal muscles that can be rescued in C9-rescue fish. Arrows indicate clusters of TDP-43 expression. c Quantification of the nucleus-to-cytoplasmic ratio for TDP-43. A significant reduction in N-to-C for TDP-43 was observed in C9-miR zebrafish (n = 7; **p < 0.005; one-way ANOVA) that can be significantly rescued upon the expression of the human C9orf72 mRNA (n = 5; *p < 0.05; one-way ANOVA). Scale bar = 50 μm. Data are presented as mean ± SEM. n represents the number of fish.

Adult zebrafish C9-miR display muscle atrophy, smaller motoneurons and behavioural deficits.

a Representative traces of swimming activity of five adult controls and C9-miR fishes (12-month old) during 30 s (left panel). b C9-miR fish exhibit behavioural deficits (right panel) (n = 5, ***p < 0.0001, Student’s t test). c Adult 12-month-old NMJs were examined in trunk section by co-immunostaining SV2 (green) and α-bungarotoxin (red). d Quantification of the colocalizing presynaptic and postsynaptic clusters at NMJ in adult (12-month old) wild-type control (n = 6) and C9-miR fish (n = 7) (***p < 0.0001, Student’s t test). e ChAT staining in adult zebrafish spinal cord . f Large (mature) motor neurons (inset in e; scale bar = 10 μm) are reduced in size in C9-miR compared to controls (n = 4; ***p < 0.0001, Student’s t test). g Examination of adult zebrafish muscle myotomes by haematoxylin and eosin staining. h C9-miR fish display a smaller diameter of muscle fibres compared to controls (n = 10; ***p < 0.0001, Student’s t test). Data are presented as mean ± SEM. Scale bar = 50 μm. n represents the number of sections from three adult fish per genotype.

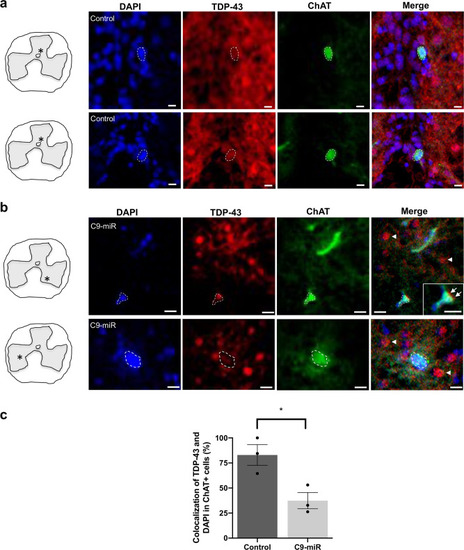
Representative fluorescence images of spinal motor neurons immunostained with antibodies against ChAT (green), TDP-43 (red) and labelled with DAPI (blue) in 14–16-month-old adult (a) control (wild type) or (b) C9-miR spinal cord sections. Scale bar = 20 μm. Arrows and arrowheads illustrate TDP-43 mislocalization. c Quantification of colocalization (%) between the total cellular TDP-43 antibody signal and the nuclear DAPI stain in ChAT-positive motor neurons in C9-miR fish normalized to colocalization percentage in control fish (n = 3; *p = 0.0251, Student’s t test). Data are presented as mean ± SEM. n represents the number of fish.

Sv2a interacts with C9orf72 and its protein expression is downregulated in C9-miR fish.

a Volcano plot showing the log2 fold change against the −log10 p value. Proteins in blue are upregulated while proteins in red are downregulated (log2 fold change of −1.5 and 1.5, delineated by vertical lines) and are significantly dysregulated (−log10 (p value) > 1.301, delineated by horizontal dotted line) between control and C9-miR fish (N = 4). b Differentially expressed proteins with p < 0.05 in C9-miR 6 dpf larvae (N = 4). c Immunoblot analysis of RFP-immunoprecipitated proteins and lysate of HEK293T cells co-expressing RFP-tagged C9orf72 or RFP in combination with Myc-tagged SV2a or Myc-tagged SMRC8 (a known interactor of C9orf72; positive control). Myc-SV2a and Myc-SMCR8 were extracted out of solution in samples where RFP-C9orf72 was co-transfected, but not in samples where RFP was co-transfected (N = 3).

C9orf72 regulates synaptic active zones and activity at the neuromuscular junction.

a FM1-43 loading of NMJ boutons in 6 dpf fish. C9-miR fish displayed decreased FM1-43 loading compared to controls. b Quantification of FM1-43 fluorescent intensity in control (n = 14) and C9-miR fish (n = 16), showing a reduced FM1-43 fluorescent intensity in C9-miR fish (p < 0.0001; Student’s t test). c Putative synapses (arrows) were visualized with Rab3a immunostaining at 6 dpf (inset; scale bar = 10 μm). Rab3a+ synaptic puncta were reduced in number (d) and area (e) in 6 dpf C9-miR larvae when compared with wild-type controls (n = 5; ***p < 0.0001; Student’s t test). Scale bar = 50 μm. Data are presented as mean ± SEM. n represents the number of fish.

Acknowledgments
This image is the copyrighted work of the attributed author or publisher, and ZFIN has permission only to display this image to its users. Additional permissions should be obtained from the applicable author or publisher of the image. Full text @ Commun Biol