IMAGE

Fig. 4

ID
ZDB-IMAGE-210712-7
Source
Figures for Butti et al., 2021
Image
Figure Caption

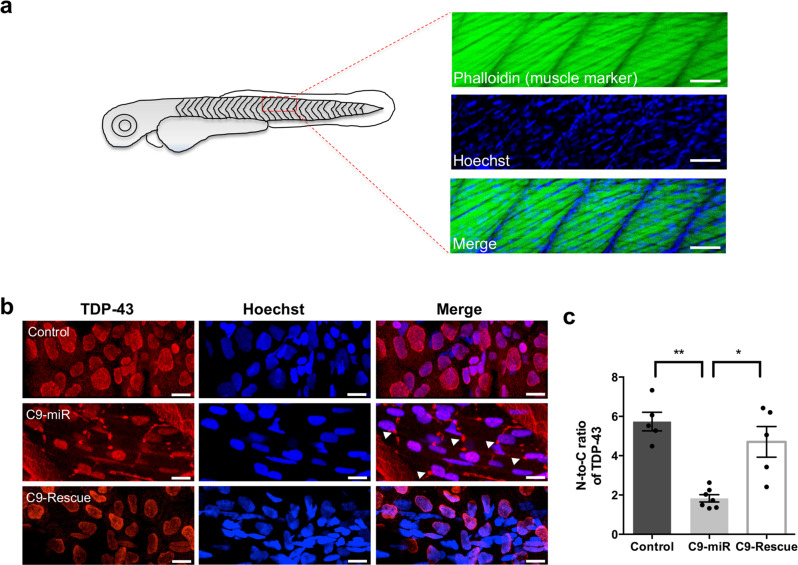
Fig. 4 C9-miR zebrafish displayed TDP-43 pathology.

a Illustration of 6 dpf zebrafish skeletal muscle cells with large nuclei labelled with muscle marker, phalloidin, and nucleus marker, Hoechst. b Representative images of 6 dpf zebrafish skeletal muscle cells for TDP-43. Compared to control fish, we observed cytoplasmic clustering of TDP-43 expression in the C9-miR skeletal muscles that can be rescued in C9-rescue fish. Arrows indicate clusters of TDP-43 expression. c Quantification of the nucleus-to-cytoplasmic ratio for TDP-43. A significant reduction in N-to-C for TDP-43 was observed in C9-miR zebrafish (n = 7; **p < 0.005; one-way ANOVA) that can be significantly rescued upon the expression of the human C9orf72 mRNA (n = 5; *p < 0.05; one-way ANOVA). Scale bar = 50 μm. Data are presented as mean ± SEM. n represents the number of fish.

Acknowledgments
This image is the copyrighted work of the attributed author or publisher, and ZFIN has permission only to display this image to its users. Additional permissions should be obtained from the applicable author or publisher of the image. Full text @ Commun Biol