
|
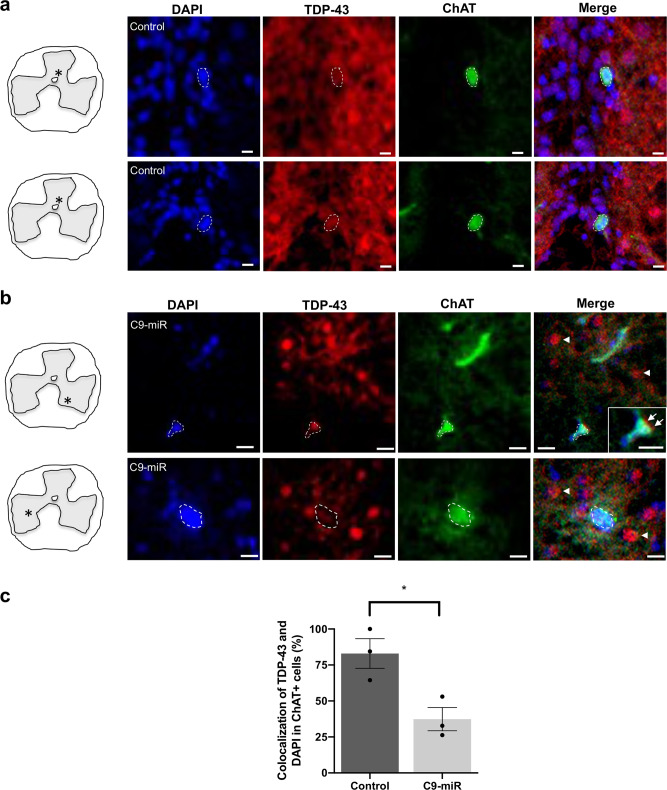
Fig. 6 Representative fluorescence images of spinal motor neurons immunostained with antibodies against ChAT (green), TDP-43 (red) and labelled with DAPI (blue) in 14–16-month-old adult (a) control (wild type) or (b) C9-miR spinal cord sections. Scale bar = 20 μm. Arrows and arrowheads illustrate TDP-43 mislocalization. c Quantification of colocalization (%) between the total cellular TDP-43 antibody signal and the nuclear DAPI stain in ChAT-positive motor neurons in C9-miR fish normalized to colocalization percentage in control fish (n = 3; *p = 0.0251, Student’s t test). Data are presented as mean ± SEM. n represents the number of fish.