IMAGE

Fig. 1

ID
ZDB-IMAGE-210712-4
Source
Figures for Butti et al., 2021
Image
Figure Caption

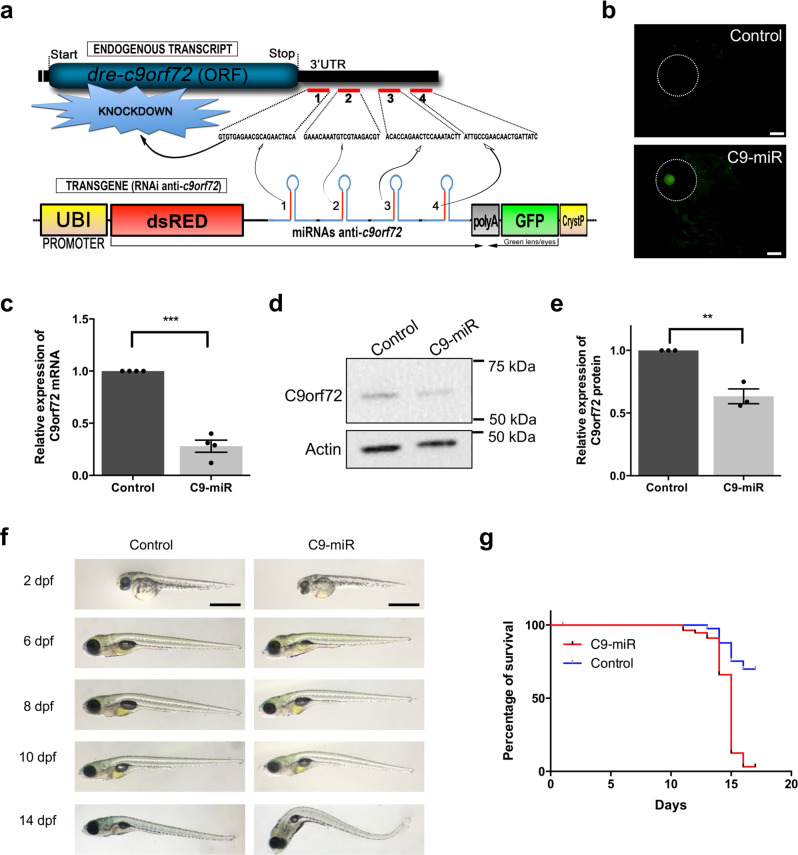
Fig. 1 Generation of a stable zebrafish C9orf72 knockdown line.

a Schematic representation of the technique used to silence C9orf72 in zebrafish. The transgene is designed to express four different micro-RNAs targeting C9orf72’s 3’UTR and triggering knockdown by both repressing C9orf72 translation and affecting its stability. b Images demonstrating proper eGFP expression in the crystallin of the transgenic fish, a marker used to identify carrier/knockdown larvae. Scale bar = 100 μm. c Bar graph shows the relative expression of the endogenous C9orf72 gene. mRNA was normalized to elf1α mRNA levels (N = 4, ***p < 0.0001, Student’s t test). d Immunoblotting of the zebrafish protein C9orf72 and beta-actin as control. e Bar graph shows the relative expression of the C9orf72 protein compared with actin between C9orf72 mutants and control line (N = 3; **p = 0.0034; Student’s t test). f Gross morphological analyses of wild-type control and C9orf72-LOF fish (C9-miR). g Kaplan–Meier survival plot over 17 days after fertilization (dpf) showing low survival of C9-miR compared to controls after 10 dpf (N = 3, n = 25). Data are presented as mean ± SEM. n represents the number of fish, N represents the number of experimental repeats.

Acknowledgments
This image is the copyrighted work of the attributed author or publisher, and ZFIN has permission only to display this image to its users. Additional permissions should be obtained from the applicable author or publisher of the image. Full text @ Commun Biol