
- Title
-
Mapping single-cell atlases throughout Metazoa unravels cell type evolution
- Authors
- Tarashansky, A.J., Musser, J.M., Khariton, M., Li, P., Arendt, D., Quake, S.R., Wang, B.
- Source
- Full text @ Elife

(A) Schematic showing the phylogenetic relationships among seven species analyzed. (B) Challenges in mapping single-cell transcriptomes. Gene duplications cause large numbers of homologs per gene, determined by reciprocal BLAST (cut-off: E-value <10−6), and frequent gene losses and the acquisition of new genes result in large fractions of transcriptomes lacking homology, which limits the amount of information comparable across species. (C) SAMap workflow. Homologous gene pairs initially weighted by protein sequence similarity are used to align the manifolds, low dimensional representations of the cell atlases. Gene-gene correlations calculated from the aligned manifolds are used to update the edge weights in the bipartite graph, which are then used to improve manifold alignment. (D) Mutual nearest neighborhoods improve the detection of cross-species mutual nearest neighbors by connecting cells that target one other’s within-species neighborhoods. (E) Convergence of SAMap is evaluated by the root mean square error (RMSE) of the alignment scores between mapped clusters in adjacent iterations for all 21 pairwise comparisons of the seven species. |

The runtime ( |
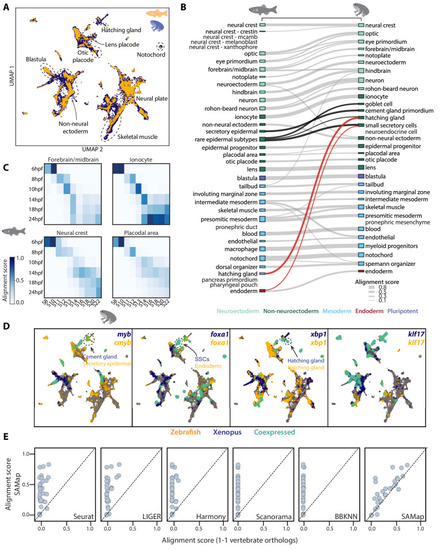
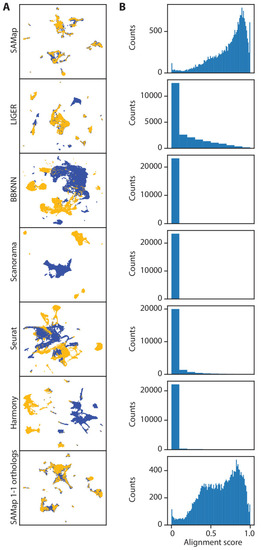
(A) UMAP projection of the combined zebrafish (yellow) and Xenopus (blue) manifolds, with example cell types circled. (B) Sankey plot summarizing the cell type mappings. Edges with alignment score <0.1 are omitted. Edges that connect developmentally distinct secretory cell types are highlighted in black, with connections across germ layers highlighted in red. (C) Heatmaps of alignment scores between developmental time points for ionocyte, forebrain/midbrain, placodal, and neural crest lineages. X-axis: Xenopus. Y-axis: zebrafish. (D) Expressions of orthologous gene pairs linked by SAMap are overlaid on the combined UMAP projection. Expressing cells are color-coded by species, with those connected across species colored cyan. Cells with no expression are shown in gray. The mapped secretory cell types are highlighted with circles. (E) SAMap alignment scores compared to those of benchmarking methods using one-to-one vertebrate orthologs as input. Each dot represents a cell type pair supported by ontogeny annotations. |
( |
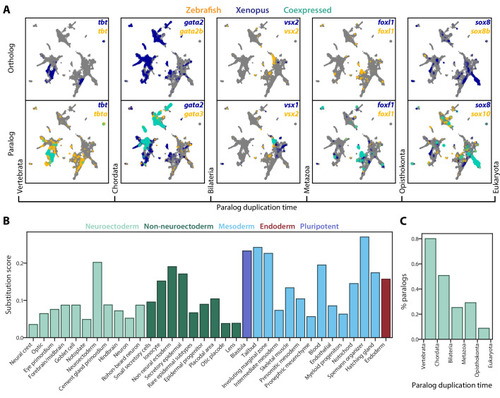
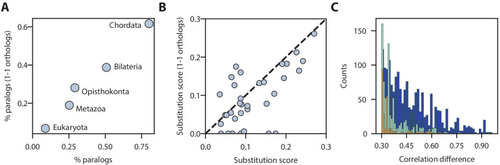
(A) Expression of orthologous (top) and paralogous (bottom) gene pairs overlaid on the combined UMAP projection. Expressing cells are color-coded by species, with those that are connected across species colored cyan. Cells with no expression are shown in gray. Paralogs are ordered by the evolutionary time when they are inferred to have duplicated. (B) Paralog substitution scores of all cell types. The substitution score counts the number of substituting paralogs that are differentially expressed in a particular cell type while normalizing for the number of differentially expressed genes in a cell type and the number of paralogs of a gene (see Materials and methods). (C) The percentage of paralogs from each phylogenetic age that were substituted for orthologs in frog or zebrafish lineages. |
Comparison of substitution rates for different paralog ages ( |
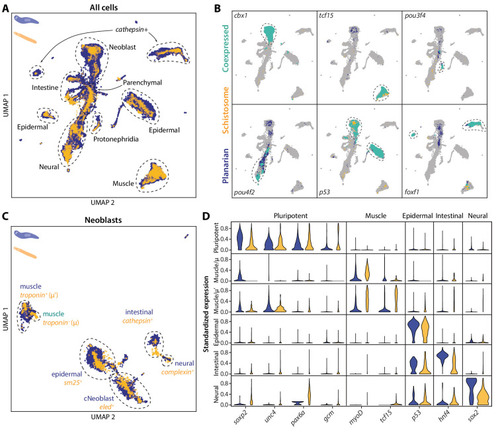
(A) UMAP projection of the combined manifolds. Tissue type annotations are adopted from the S. mediterranea atlas (Fincher et al., 2018). The schistosome atlas was collected from juvenile worms, which we found to contain neoblasts with an abundance comparable to that of planarian neoblasts (Li et al., 2021). (B) Overlapping expressions of selected tissue-specific TFs with expressing cell types circled. (C) UMAP projection of the aligned manifolds showing planarian and schistosome stem cells, with homologous subpopulations circled. Planarian neoblast data is from Zeng et al., 2018, and cNeoblasts correspond to the Nb2 population, which are pluripotent cells that can rescue neoblast-depleted planarians in transplantation experiments. (D) Distributions of conserved TF expressions in each neoblast subpopulation. Expression values are k-nearest-neighbor averaged and standardized, with negative values set to zero. Blue: planarian; yellow: schistosome. |

( |
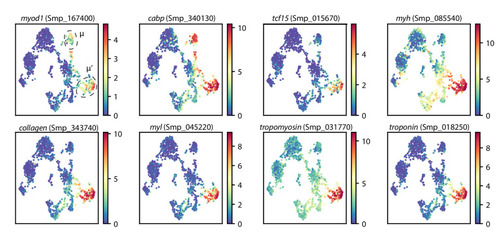
UMAP projections of schistosome stem cells with gene expressions overlaid. μ and μ’ cells are circled. Colormap: expression in units of |

(A) Schematic illustrating edge (left) and node (right) transitivities, defined as the fraction of triads (set of three connected nodes) in closed triangles. (B) The percentage of cell type pairs that are topologically equivalent to the green edge in each illustrated motif. (C) Network graphs showing highly connected cell type families. Each node represents a cell type, color-coded by species (detailed annotations are provided in Supplementary file 7). Mapped cell types are connected with an edge. (D) Boxplot showing the median and interquartile ranges of node transitivities for highly connected cell type groups. For all box plots, the whiskers denote the maximum and minimum observations. The average node transitivity per group is compared to a bootstrapped null transitivity distribution, generated by repeatedly sampling subsets of nodes in the cell type graph and calculating their transitivities. **p<5×10⁻⁵, ***p<5×10⁻⁷. (E) Boxplot showing the median and interquartile ranges of the number of enriched gene pairs in highly connected cell type groups. All cell type connections in these groups have at least 40 enriched gene pairs (dashed line). |
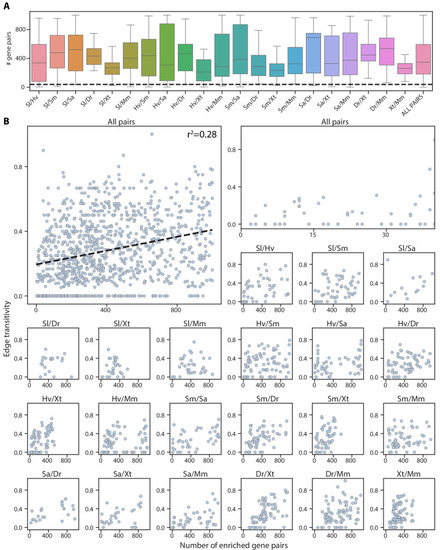
( |
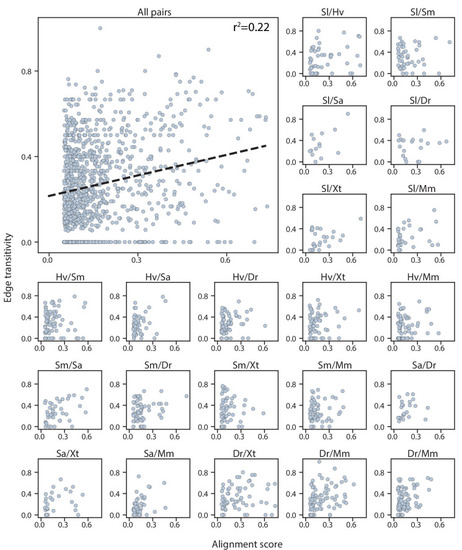
Top left: alignment scores and edge transitivity for all cell type pairs in the connectivity graph including the seven species. Dashed line: the linear best fit, with the Pearson correlation coefficient reported at the top. Alignment scores and edge transitivity for individual species pairs are shown in the remaining subplots. |
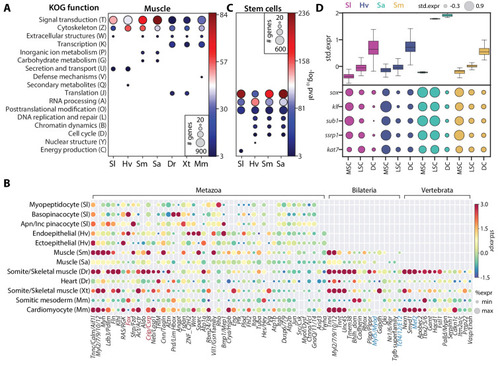
(A) Enrichment of KOG functional annotations calculated for genes shared in contractile cell types. For each species, genes enriched in individual contractile cell types are combined. (B) Expression and enrichment of conserved muscle genes in contractile cell types. Color: mean standardized expression. Symbol size: the fraction of cells each gene is expressed in per cell type. Homologs are grouped based on overlapping eukaryotic eggNOG orthology groups. If multiple genes from a species are contained within an orthology group, the gene with highest standardized expression is shown. Genes in blue: core transcriptional program of bilaterian muscles; red: transcriptional regulators conserved throughout Metazoa. (C) Enrichment of KOG functional annotations for genes shared by stem cell types. (D) Top: boxplot showing the median and interquartile ranges of the mean standardized expressions of stem cell-enriched genes in multipotent stem cells (MSCs), lineage-committed stem cells (LSCs), and differentiated cells (DCs). MSCs include sponge archaeocytes (Musser et al., 2019), hydra interstitial stem cells (Siebert et al., 2019), planarian neoblasts cluster 0 defined in Fincher et al., 2018, schistosome ε-cells (Tarashansky et al., 2019). LSCs include sponge transition cells, hydra ecto- and endo-epithelial stem cells; planarian piwi+ cells that cluster with differentiated tissues, and schistosome tissue-specific progenitors. Bottom: dot plot showing the mean standardized expressions of selected transcriptional regulators. The transcript IDs corresponding to each gene are listed in Supplementary file 6. |
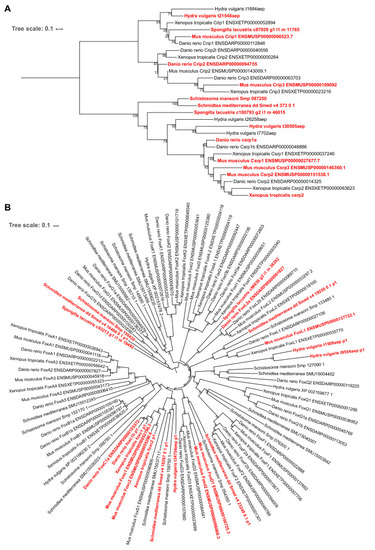
Trees depict |