
|
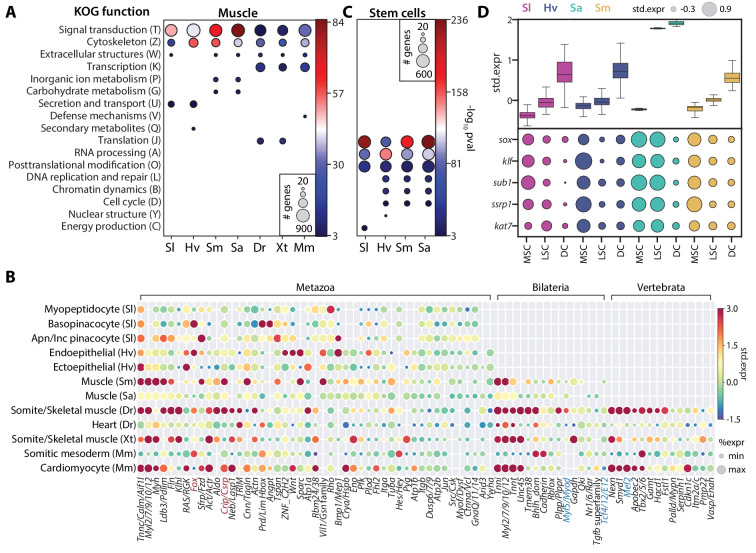
Figure 6 (A) Enrichment of KOG functional annotations calculated for genes shared in contractile cell types. For each species, genes enriched in individual contractile cell types are combined. (B) Expression and enrichment of conserved muscle genes in contractile cell types. Color: mean standardized expression. Symbol size: the fraction of cells each gene is expressed in per cell type. Homologs are grouped based on overlapping eukaryotic eggNOG orthology groups. If multiple genes from a species are contained within an orthology group, the gene with highest standardized expression is shown. Genes in blue: core transcriptional program of bilaterian muscles; red: transcriptional regulators conserved throughout Metazoa. (C) Enrichment of KOG functional annotations for genes shared by stem cell types. (D) Top: boxplot showing the median and interquartile ranges of the mean standardized expressions of stem cell-enriched genes in multipotent stem cells (MSCs), lineage-committed stem cells (LSCs), and differentiated cells (DCs). MSCs include sponge archaeocytes (Musser et al., 2019), hydra interstitial stem cells (Siebert et al., 2019), planarian neoblasts cluster 0 defined in Fincher et al., 2018, schistosome ε-cells (Tarashansky et al., 2019). LSCs include sponge transition cells, hydra ecto- and endo-epithelial stem cells; planarian piwi+ cells that cluster with differentiated tissues, and schistosome tissue-specific progenitors. Bottom: dot plot showing the mean standardized expressions of selected transcriptional regulators. The transcript IDs corresponding to each gene are listed in Supplementary file 6.