
Figure 3
- ID
- ZDB-FIG-210526-29
- Publication
- Tarashansky et al., 2021 - Mapping single-cell atlases throughout Metazoa unravels cell type evolution
- Other Figures
- All Figure Page
- Back to All Figure Page
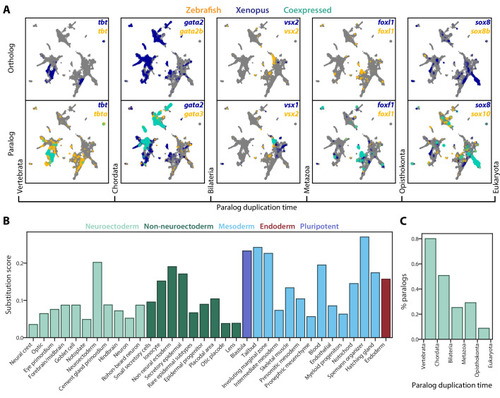
(A) Expression of orthologous (top) and paralogous (bottom) gene pairs overlaid on the combined UMAP projection. Expressing cells are color-coded by species, with those that are connected across species colored cyan. Cells with no expression are shown in gray. Paralogs are ordered by the evolutionary time when they are inferred to have duplicated. (B) Paralog substitution scores of all cell types. The substitution score counts the number of substituting paralogs that are differentially expressed in a particular cell type while normalizing for the number of differentially expressed genes in a cell type and the number of paralogs of a gene (see Materials and methods). (C) The percentage of paralogs from each phylogenetic age that were substituted for orthologs in frog or zebrafish lineages. |