
- Title
-
Kapd Is Essential for Specification of the Dopaminergic Neurogenesis in Zebrafish Embryos
- Authors
- Jung, J., Kim, E., Rhee, M.
- Source
- Full text @ Mol. Cells
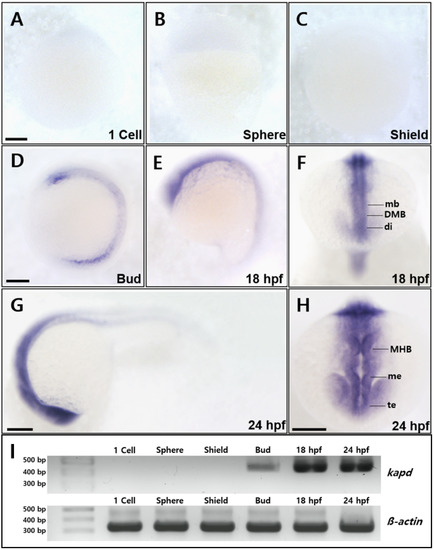
Spatiotemporal expression patterns of zebrafish kapd. WISH analysis of kapd from the one-cell stage through 36 hpf. (A-C) Transcripts of kapd were not detected from the one-cell stage through the shield stage. (D) At the bud stage, kapd transcripts were first detected in the FP cell of the neural tube. (E and F) Transcripts were abundant in the central nervous system from 10 hpf through to 18 hpf. At 18 hpf, kapd transcripts were distributed in the precursor region of the midbrain, including the diencephalic–mesencephalic boundary along the anterior–posterior (AP) axis (F). (G and H) At 24 hpf, kapd expression was restricted to the forebrain through the hindbrain including the telencephalon, mesencephalon, and rhombomere (H). (I) RT-PCR analysis of kapd transcripts at the developmental stages in zebrafish embryos. β-actin was used as loading control. (A-H) Scale bars = 250 µm. All embryos were collected synchronously from WT zebrafish for WISH analysis at the corresponding stages. mb, midbrain; DMB, diencephalic–mesencephalic boundary; di, diencephalon; MHB, midbrain–hindbrain boundary; me, mesencephalon; te, telencephalon. |
Spatiotemporal expression patterns of zebrafish kapd. WISH analysis of kapd from the one-cell stage through 36 hpf. (A-C) Transcripts of kapd were not detected from the one-cell stage through the shield stage. (D) At the bud stage, kapd transcripts were first detected in the FP cell of the neural tube. (E and F) Transcripts were abundant in the central nervous system from 10 hpf through to 18 hpf. At 18 hpf, kapd transcripts were distributed in the precursor region of the midbrain, including the diencephalic–mesencephalic boundary along the anterior–posterior (AP) axis (F). (G and H) At 24 hpf, kapd expression was restricted to the forebrain through the hindbrain including the telencephalon, mesencephalon, and rhombomere (H). (I) RT-PCR analysis of kapd transcripts at the developmental stages in zebrafish embryos. β-actin was used as loading control. (A-H) Scale bars = 250 µm. All embryos were collected synchronously from WT zebrafish for WISH analysis at the corresponding stages. mb, midbrain; DMB, diencephalic–mesencephalic boundary; di, diencephalon; MHB, midbrain–hindbrain boundary; me, mesencephalon; te, telencephalon. |
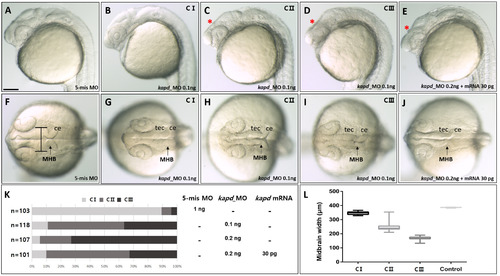
Repression of kapd expression decreases the size of the mesencephalon, including the midbrain ventricle, at 24 hpf. Microinjection of kapd morpholino (0.1 ng) into an embryo at the one-cell stage to knock down DEG-13. (A) 5-mismatch MO and (B-D) kapd morphants were categorized as class I, II, or III (C I, C II, or C III). (E) Rescue of a kapd morphant (0.2 ng) with kapd mRNA (30 pg). (F-J) Dorsal view of the midbrain, midbrain–hindbrain boundary, and hindbrain of kapd morphants at 24 hpf. (F) 5-mismatch MO. (G-I) At 24 hpf, embryos were injected with kapd MO. (J) kapd mRNA (30 pg) was injected into a kapd morphant at the one-cell stage (0.2 ng). (K) The proportion of moderately deformed embryos (class II) was higher after rescue with kapd mRNA. (L) Measurement of midbrain widths revealed a significant reduction of the neural tube in kapd morphants. Statistical significance was calculated using one-way ANOVA, and multiple comparisons between groups were analyzed by Dunnett’s test. (A-J) Scale bar = 250 µm. MHB, midbrain–hindbrain boundary; ce, cerebellum; tec, tectum. PHENOTYPE:
|
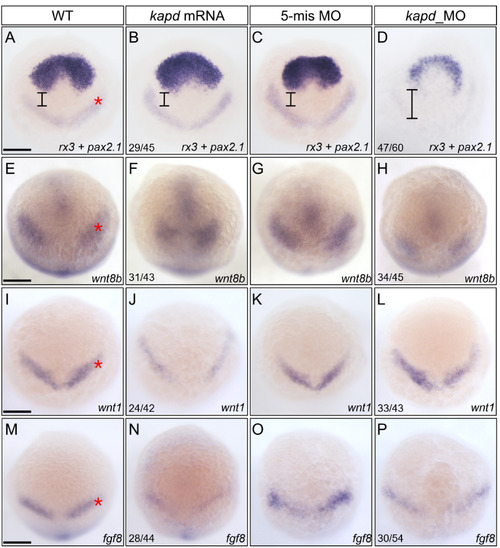
Spatiotemporal expression patterns of markers for presumptive midbrain and DA progenitors at 10 hpf . (A-D) WISH analysis using rx3 and pax2.1 as a molecular marker for the forebrain and midbrain domains indicates that loss of kapd function disrupted the presumptive midbrain development. (A) WT embryo. Microinjection of kapd mRNA (30 pg per embryo) into wild-type embryos thickened the anterior forebrain (B). kapd 5-mismatch control embryos had the similar expression patterns in the presumptive midbrain (C) to that of WT (A). In contrast, knock-down of kapd (0.2 ng morpholino per embryo) repressed MHB (asterisk) and telencephalic precursors in kapd morphants at 10 hpf (D). (E-H) WISH analysis with wnt8b as a molecular marker for the midbrain in anterior brain patterning. wnt8b transcripts were present in the midbrain of WT (E) and control embryos injected with 5-mismatch (G). Overexpression of kapd (kapd mRNA 30 pg per embryo) shortened the MHB area (F) while knock-down of kapd (0.2 ng of kapd morpholino per embryo) remarkably reduced the level of wnt8b transcripts in the MHB (asterisk) and anterior midbrain of the morphants (H). (I-P) WISH analysis with wnt1 and fgf8 as molecular markers for DA progenitors at 10 hpf. WT embryos (I and M), embryos injected with kapd mRNA (J and N). kapd mRNA injected embryos showed narrower and reduced expression patterns for wnt1 (J) and fgf8 (N). The level of wnt1 transcripts was not significantly changed in the midbrain neural keel region of kapd morphants (L). However, transcripts of fgf8 were reduced in the MHB neural keel in comparison to those of control embryos at 10 hpf (M-P). (A-P) Scale bars = 250 μm. |
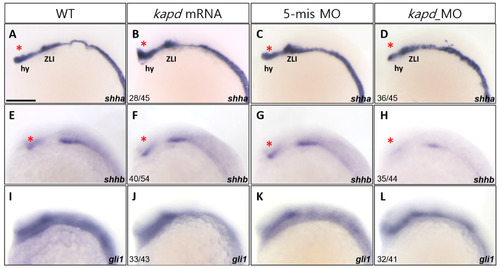
Knockdown of kapd expression alters the expression patterns of the molecular markers shha and shhb. (A-D) WISH analysis using shha as a molecular marker for the thalamus (asterisks) and zona limitans intrathalamica (ZLI) revealed that loss of kapd function disrupts diencephalic differentiation. (A) WT embryo. Microinjection of kapd mRNA (50 pg per embryo) into WT embryos increased expression in the hypothalamus (hy) (B). Expression patterns of kapd in the hypothalamus of 5-mismatch MO control embryos (C) were similar to those of WT embryos (A). By contrast, in kapd morphants at 16.5 hpf, knockdown of kapd (0.2 ng MO per embryo) decreased expression in the hypothalamus (D). (E-H) shhb transcripts were present in the ventral FP (asterisks) of WT embryos at 16.5 hpf (E). Overexpression of kapd did not cause significant changes in the ventral FP of the forebrain (F), whereas knockdown of kapd (0.2 ng of kapd morpholino per embryo) markedly decreased the level of shhb transcripts in the ventral diencephalon of the morphants (H). Embryos were examined for expression of the ventral neural marker, gli1, at 16.5 hpf. Transcript levels of gli1 were not affected by overexpression or knockdown of kapd (I-L). (A-L) Scale bar = 250 µm. EXPRESSION / LABELING:
PHENOTYPE:
|
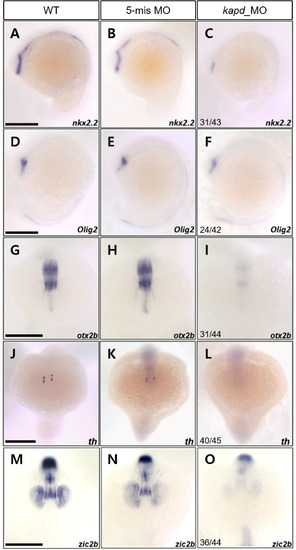
Knockdown of kapd decreases the transcript levels of markers of immature and mature DA neurons in the ventral diencephalon at 18 hpf. (A-F) WISH analysis with nkx2.2- and olig2-specific probes detected reduction in their transcripts in the ventral diencephalon at 18 hpf. (A) WT embryo, (B) 5-mismatch MO control, and (C) kapd MO (0.2 ng of kapd morpholino per embryo). (G-L) WISH analysis of kapd MO (0.2 ng of kapd morpholino per embryo) using otx2b and th as probes. (G) otx2b transcripts in the midbrain of WT embryos at 18 hpf. (H) Embryos injected with 5-mismatch showed similar patterns to those of WT embryos. (I) kapd MO shows remarkable reduction of otx2b transcripts in the midbrain including midbrain ventricle at 18 hpf. Transcripts of th in WT (J), 5-mismatch control (K), and kapd MO (L) at 18 hpf. th transcripts were present in the ventral diencephalon in WT and 5-mismatch control whereas the expression was lost in the corresponding areas of kapd morphants. (M-O) Embryos were examined for the expression of neural crest marker, zic2b at 18 hpf. Transcripts of zic2b in WT (M) and 5-mis MO control (N). Injection of kapd MO caused notable reduced zic2b expression domains, ventral diencephalic and mesencephalic region at 18 hpf (O). (A-O) Scale bars = 100 μm. EXPRESSION / LABELING:
PHENOTYPE:
|
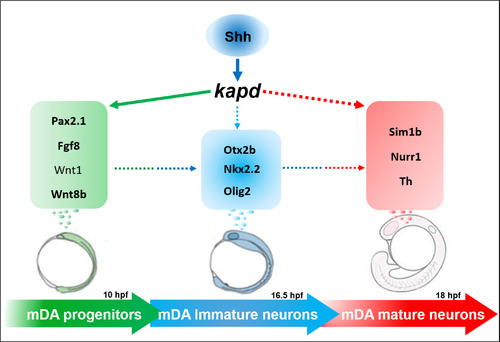
kapd is associated with genetic networks controlling the development of mDA neurons in zebrafish system. The diagram summarizes the sequential stages and the molecules involved in the mDA neuron embryonic development. The expression of kapd is involved in cranial neural crest induction and midbrain neural tube morphogenesis, which are prerequisites for differentiation and maturation of the mDA neurons at various embryonic stages. Lines depict possible interactions among these molecules and arrows indicate stimulatory effects. The green colored, delimited by a green box, molecules involved in mDA progenitors. The light blue colored groups in box and circle are involved in immature mDA neurons. The red colored area clusters the genes involved in mature mDA identity. |