
- Title
-
Phosphatidylinositol-3 kinase signaling controls survival and stemness of hematopoietic stem and progenitor cells
- Authors
- Blokzijl-Franke, S., Ponsioen, B., Schulte-Merker, S., Herbomel, P., Kissa, K., Choorapoikayil, S., den Hertog, J.
- Source
- Full text @ Oncogene
|
|

|
|
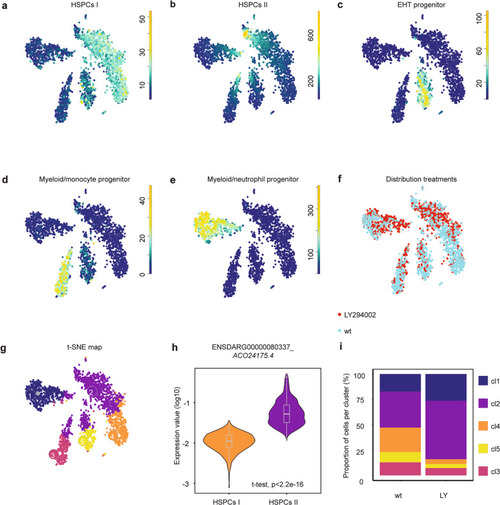
Tissue from control and LY294002-treated embryos (~2000 each) was dissected, the AGM regions pooled, dissociated and FACS sorted, after which the SORT-seq protocol was performed. |
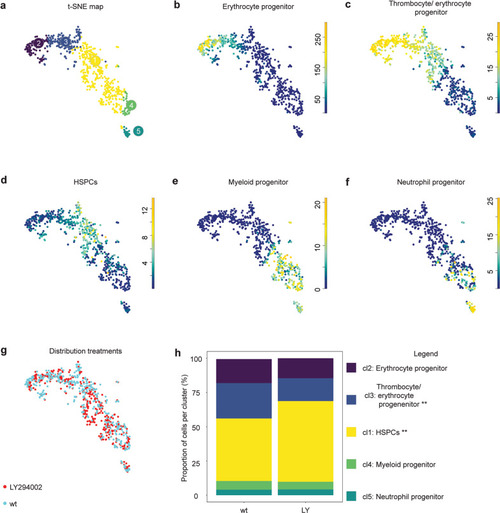
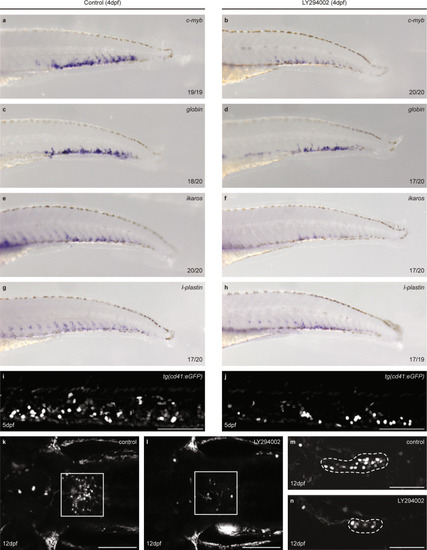
CHTs of control and LY294002-treated embryos (5 dpf, ~100 embryos each) were dissected, pooled, dissociated, FACS sorted and submitted to SORT-seq. |
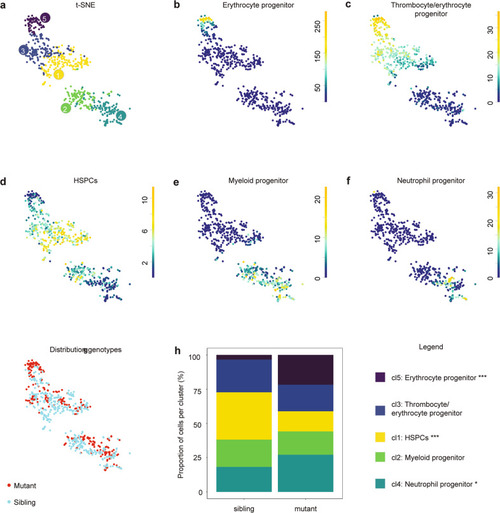
CHTs of control and |