IMAGE

Fig. 3

ID
ZDB-IMAGE-210501-14
Source
Figures for Blokzijl-Franke et al., 2021
Image
Figure Caption

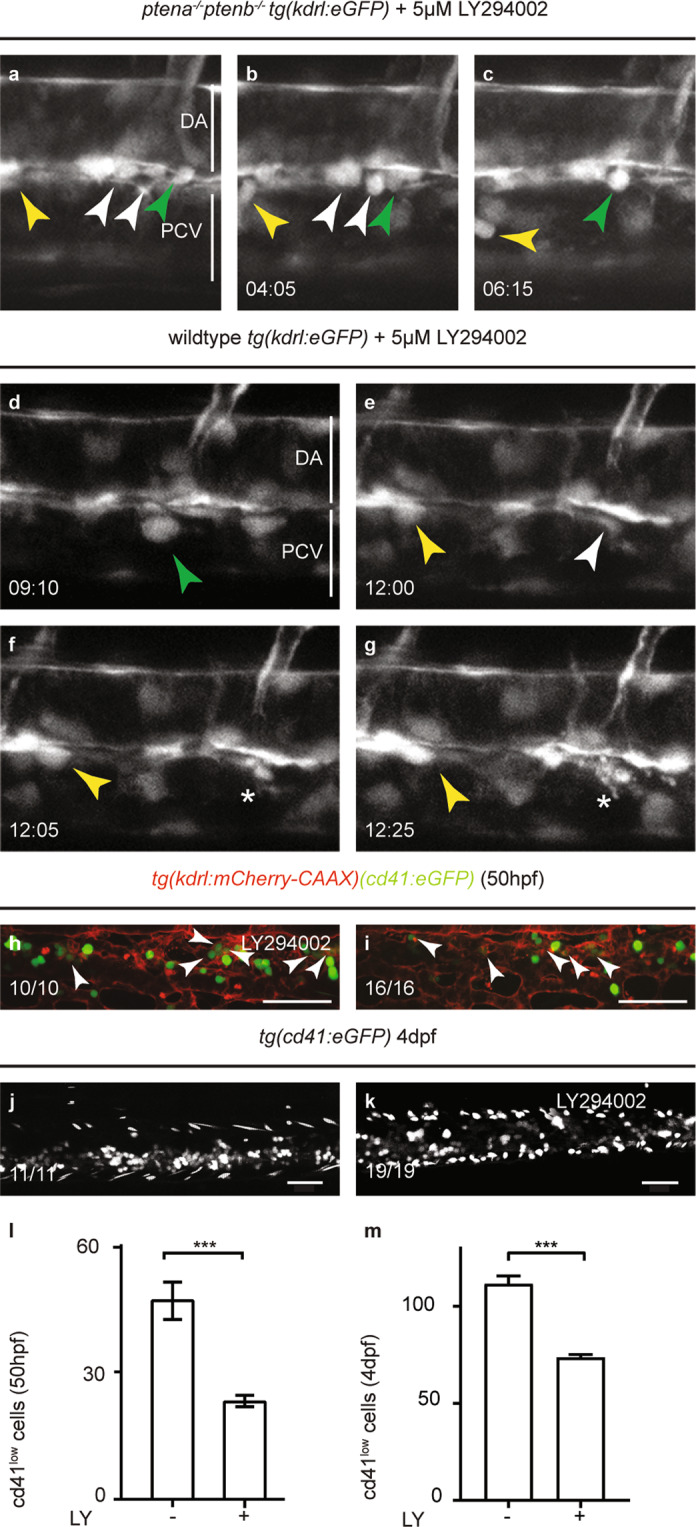
Fig. 3 Inhibition of PI3K rescued EHT in <italic>ptena</italic><sup><italic>−/−</italic></sup><italic>ptenb</italic><sup><italic>−/−</italic></sup> mutant embryos, but induced abortive EHT in wild-type embryos.

ag Four-dimensional imaging of tg(kdrl:eGFP) transgenic embryos. acptena−/−ptenb−/− mutant embryos and dg wild-type embryos. Imaging was done from 35 hpf onwards following treatment with 5 µM LY294002 from 32 hpf. Still frames from movie S3 (ac) and movie S4 (dg). arrowheads: HSPCs. Asterisks: disintegrating HSPCs. Different colors of arrowheads distinguish separate EHT events. Images were taken with ×40 objective and ×1 zoom. Time in hh:mm; DA dorsal aorta, PCV posterior cardinal vein. h, i CHTs of tg(kdrl:mCherry-CAAX/cd41:eGFP) control (n = 10) and LY294002-treated (5 µM, 32–50 hpf) (n = 16) embryos were imaged at 50 hpf. The vasculature is highlighted in red (mCherry) and some GFPlow HSPCs are indicated by arrows. j, k CHTs of tg(cd41:eGFP) control (n = 11) and LY294002-treated (5 µM, 30–60 hpf) (n = 19) embryos were imaged at 4 dpf. Anterior to the left; 2 µm step size. Representative embryos are shown and the number of embryos that showed this pattern/total number of embryos is indicated. The number of GFPlow HSPCs was determined at 50 hpf (l) and 4 dpf (m) and is expressed as average number of cells; error bars indicate standard error of the mean (SEM). Shapiro–Wilk test for normal distribution and Welch’s two-tailed t-test were used for statistical analysis; ***p < 0.001.

Acknowledgments
This image is the copyrighted work of the attributed author or publisher, and ZFIN has permission only to display this image to its users. Additional permissions should be obtained from the applicable author or publisher of the image. Full text @ Oncogene