FIGURE

Fig. 5

ID
ZDB-FIG-210501-15
Publication
Blokzijl-Franke et al., 2021 - Phosphatidylinositol-3 kinase signaling controls survival and stemness of hematopoietic stem and progenitor cells
Other Figures
All Figure Page
Back to All Figure Page
Fig. 5

scRNA-seq reveals two types of HSPCs, one of which is lost upon inhibition of the PI3K-pathway.

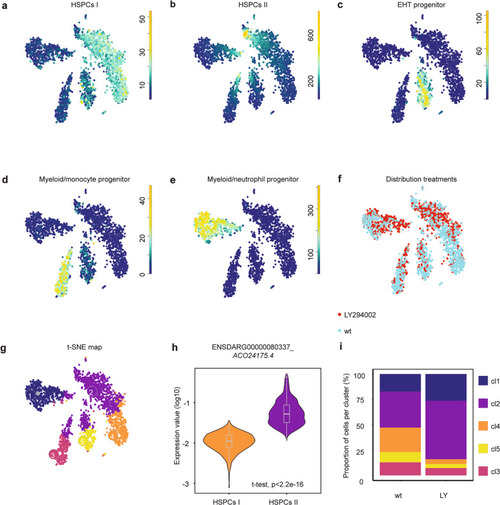
Tissue from control and LY294002-treated embryos (~2000 each) was dissected, the AGM regions pooled, dissociated and FACS sorted, after which the SORT-seq protocol was performed. ae t-SNE maps highlighting the expression of marker genes for each of the different cell types found. Transcript counts are given in a linear scale. a HSPCs I, b HSPCs II, c EHT progenitor, d Myeloid/monocyte progenitors, e Myeloid/neutrophil progenitors. f t-SNE map highlighting the distribution of cells from LY294002-treated embryos and their controls (g). Visualization of k-medoid clustering and cell-to-cell distances using t-SNEs. Each dot represents a single cell. Colors and numbers indicate cluster and correspond to colors in i. The distribution of in total 2512 cells over the five clusters are shown as percentage of total for control and LY294002-treated embryos. Fisher’s exact test with multiple testing correction (Fdr) were used for statistical analysis. ***p < 0.001. cl1: Myeloid/neutrophil progenitor, cl2: HSPC II, cl3: myeloid/monocyte progenitor, cl4: HSPC I, cl5: EHT progenitor. h Normalized expression level of ENSDARG00000080337_ACO24175.4 for HSPC I and HSPC II cluster using violin plots. Normalized expression is plotted on a log10 scale.

Expression Data

Expression Detail
Antibody Labeling
Phenotype Data

Phenotype Detail
Acknowledgments
This image is the copyrighted work of the attributed author or publisher, and ZFIN has permission only to display this image to its users. Additional permissions should be obtained from the applicable author or publisher of the image. Full text @ Oncogene