|
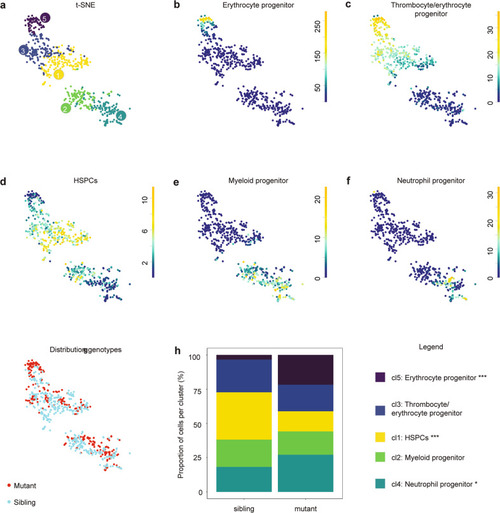
ScRNA-seq reveals a shift toward more differentiated cell types in 5 dpf old <italic>ptena</italic><sup><italic>−/−</italic></sup><italic>ptenb</italic><sup><italic>−/−</italic></sup> mutant embryos.CHTs of control and ptena−/−ptenb−/− mutant embryos (5 dpf, ~100 embryos each) were dissected, pooled, dissociated, FACS sorted and submitted to SORT-seq. a Visualization of k-medoid clustering and cell-to-cells distances using t-SNEs. Each dot represents a single cell. Colors and numbers indicate cluster and correspond to colors in h. In total, 614 cells are shown. b–f t-SNEs maps highlighting the expression of marker genes for each of the different cell types found. Transcript counts are given in a linear scale. b Erythrocyte progenitors, c Thrombocyte/erythrocyte progenitor, d HSPCs, e Myeloid progenitors, f Neutrophil progenitors. g t-SNE map highlighting the distribution of ptena−/−ptenb−/− mutant embryos and their siblings. h The percentages of cells from ptena−/−ptenb−/− mutant embryos and their siblings in the different clusters. Fisher’s exact test with multiple testing correction (Fdr) were used for statistical analysis. *p < 0.05, ***p < 0.001.
|