|
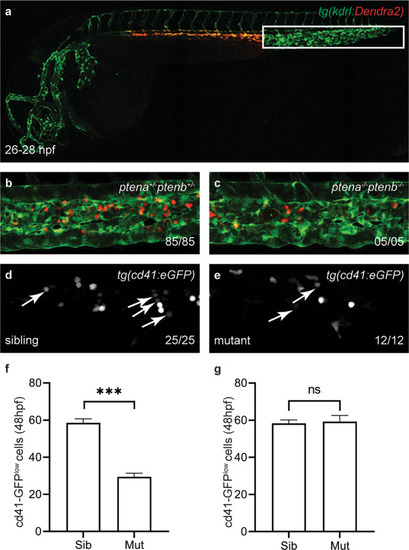
Less HSPCs colonize the CHT in <italic>ptena</italic><sup><italic>−/−</italic></sup><italic>ptenb</italic><sup><italic>−/−</italic></sup> mutant embryos than in wild-type.a The VDA of tg(kdrl:Dendra2) was photoconverted green-to-red at 26–28 hpf. By 50–60 hpf red HSPCs derived from the photoconverted VDA had colonized the CHT in b sibling and cptena−/−ptenb−/− larvae. d The number of GFPlow HSPCs at 48 hpf in the CHT of tg(cd41:eGFP) siblings (sib) (n = 25) (e) and ptena−/−ptenb−/− mutants (mut) (n = 12) (f) is expressed as average number of cells in siblings (n = 41) or ptena−/−ptenb−/−. Mutants (n = 18) (g) is expressed as average number of cells in siblings (n = 33) or ptena−/−ptenb−/− mutants after injection with synthetic ptenb-mRNA (n = 15). Error bars indicate standard error or the mean (SEM). Shapiro–Wilk test for normal distribution and Welch’s two-tailed t-test were used for statistical analysis; ***p < 0.001. Representative embryos are shown and the number of embryos that showed this pattern/total number of embryos is indicated.
|