
- Title
-
A Novel Function of TLR2 and MyD88 in the Regulation of Leukocyte Cell Migration Behavior During Wounding in Zebrafish Larvae
- Authors
- Hu, W., van Steijn, L., Li, C., Verbeek, F.J., Cao, L., Merks, R.M.H., Spaink, H.P.
- Source
- Full text @ Front Cell Dev Biol
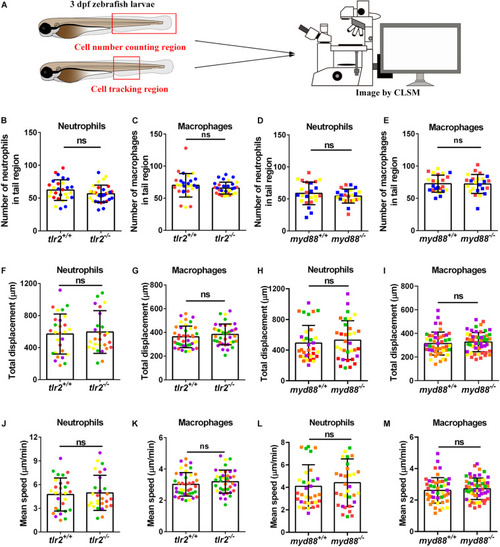
Quantification of macrophage and neutrophil numbers and their basal migratory capability in the 3 dpf |
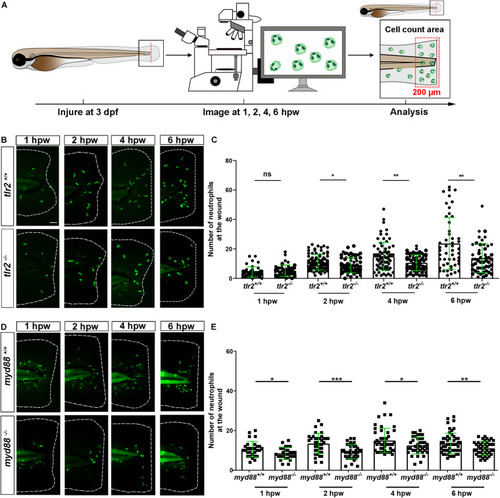
The number of neutrophils recruited to the wounded area in the PHENOTYPE:
|
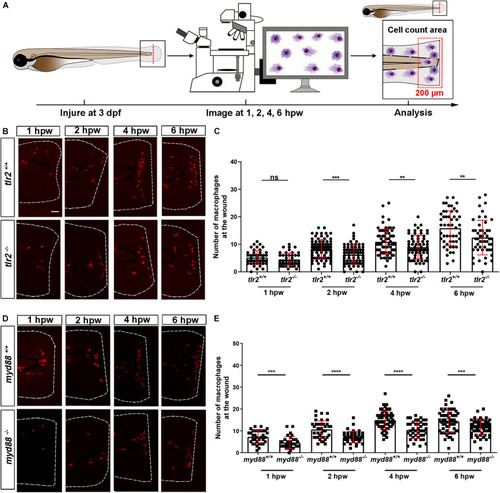
The number of macrophages recruited to the wounded area in the PHENOTYPE:
|
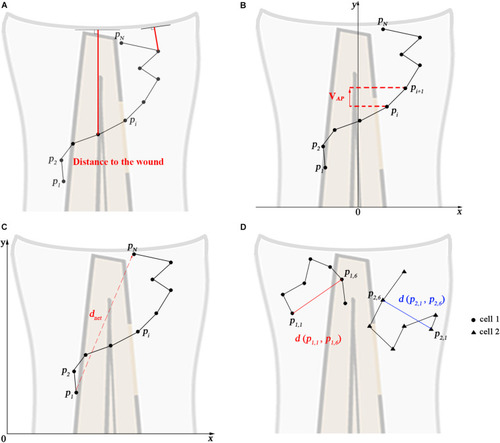
Calculated track measures. |
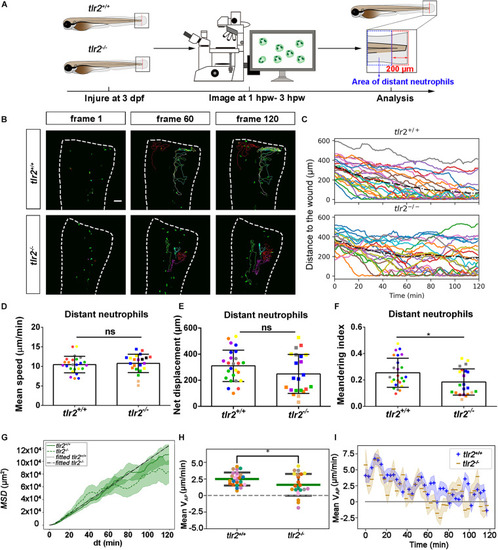
Quantification of distant neutrophils behavior in wounded PHENOTYPE:
|
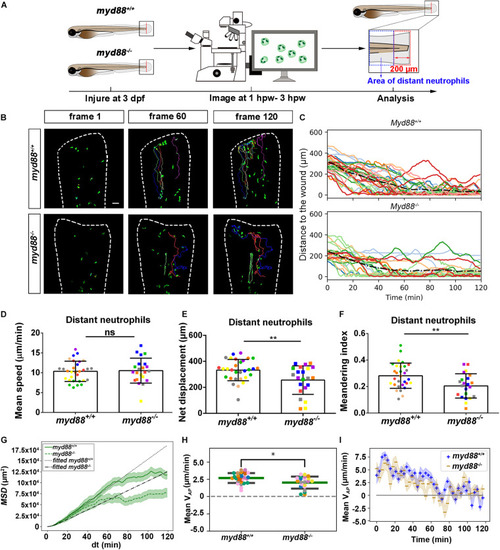
Quantification of distant neutrophils behavior in wounded PHENOTYPE:
|
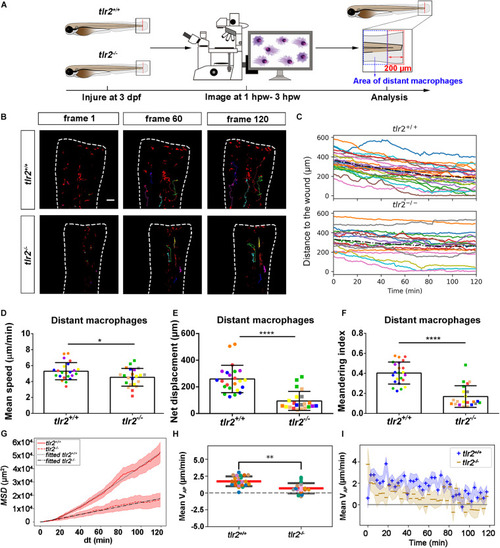
Quantification of distant macrophage behavior in wounded PHENOTYPE:
|
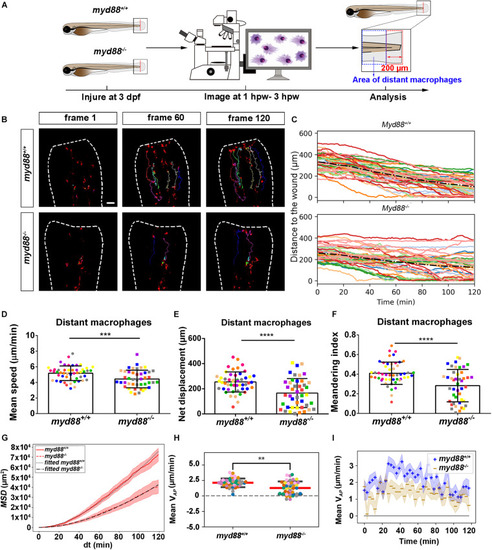
Quantification of distant macrophages behavior in wounded PHENOTYPE:
|
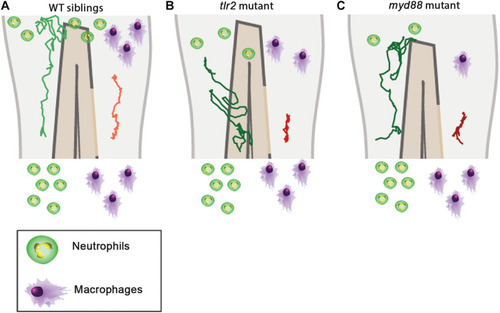
Graphic summary of the data of cell migration behavior in the |