IMAGE

FIGURE 3

ID
ZDB-IMAGE-210307-46
Source
Figures for Hu et al., 2021
Image
Figure Caption

FIGURE 3

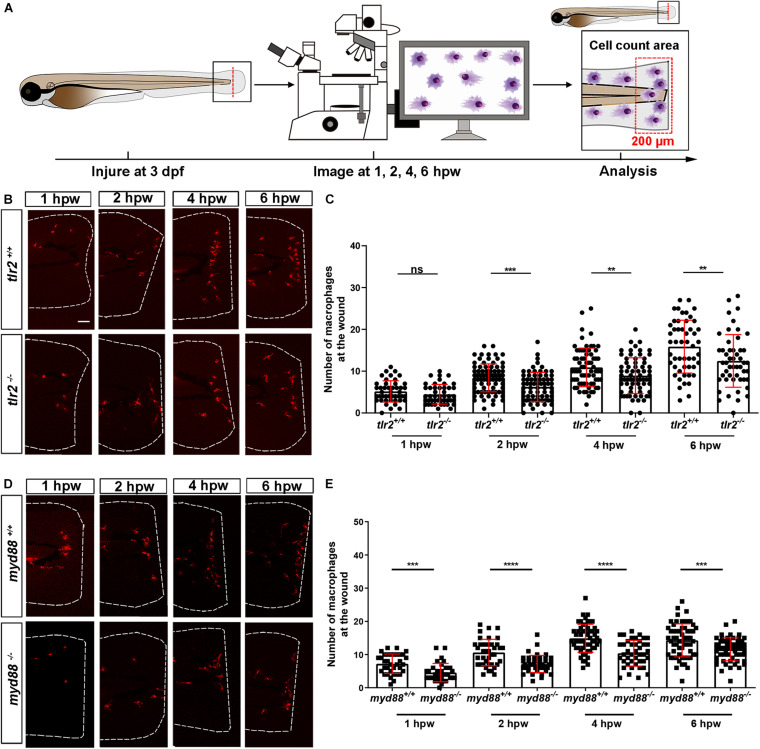
The number of macrophages recruited to the wounded area in the tlr2 and myd88 mutants and wild type sibling controls larvae. (A) Experimental scheme. Tlr2 and myd88 homozygous mutants and sibling control larvae were wounded at 3 dpf. Their tails were wounded to the tip of the notochord. The red dashed line shows the site of wounding. Recruited macrophages at the wound were imaged at 1, 2, 4, and 6 hpw by using CLSM. For recruited cell counting analysis, cells localized within an area of 200 μm from the wounding edge toward the body trunk were counted as recruited cells. The red dashed box shows the area where macrophages were counted as recruited macrophages. (B,D) Representative images of 3 dpf larvae at 1, 2, 4, and 6 hpw. Scale bar: 50 μm. (C) The quantification of recruited macrophage numbers to the wounded area at 1, 2, 4, and 6 hpw in 3 dpf tlr2+/+ and tlr2– /– larvae. Each point represents a different larva. Sample size (n): 45, 45, 82, 71, 69, 68, 51, 50. (E) The quantification of recruited macrophage numbers to the wounded area at 1, 2, 4, and 6 hpw in 3 dpf myd88+/+ and myd88– /– larvae. Each point represents a different larva. Sample size (n): 35, 34, 40, 43, 56, 42, 60, 58. In all cases, statistical analyses were done with data of three independent experiments. An unpaired, two-tailed t-test was used to assess significance (ns, no significant difference, **P < 0.01, ***P < 0.001, ****P < 0.0001) and data are shown as mean ± SD.

Acknowledgments
This image is the copyrighted work of the attributed author or publisher, and ZFIN has permission only to display this image to its users. Additional permissions should be obtained from the applicable author or publisher of the image. Full text @ Front Cell Dev Biol