IMAGE

FIGURE 1

ID
ZDB-IMAGE-210307-44
Source
Figures for Hu et al., 2021
Image
Figure Caption

FIGURE 1

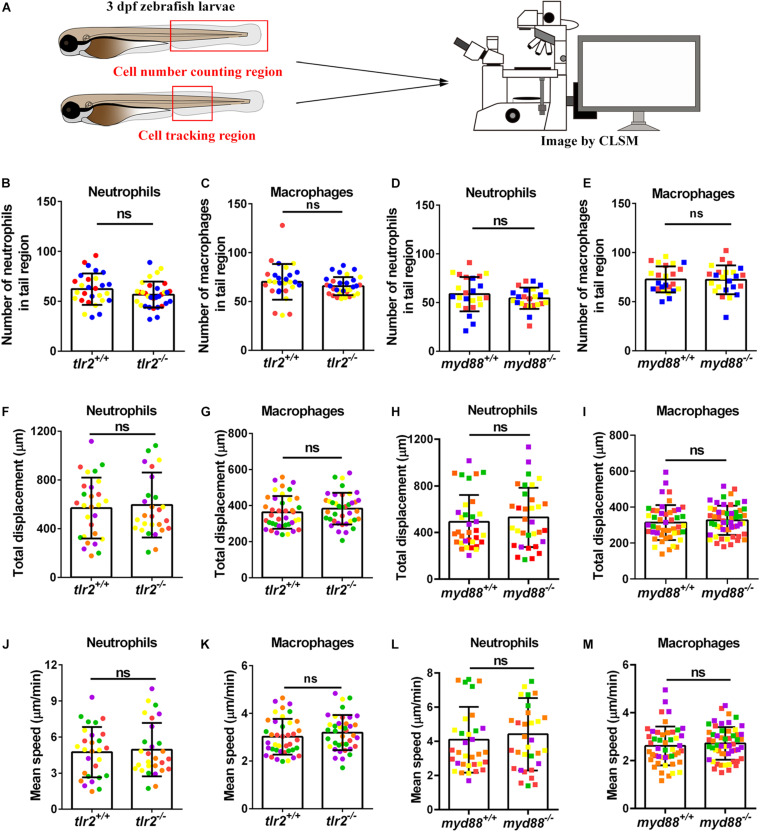
Quantification of macrophage and neutrophil numbers and their basal migratory capability in the 3 dpf tlr2 and myd88 mutants and wild sibling controls larvae. (A) Experimental scheme. At 3 dpf, numbers and basal migratory capability of GFP-labeled neutrophils and mCherry-labeled macrophages in tail region were quantified using Leica TCS SP8 confocal laser scanning microscopy (CLSM). Red boxes show the area in which cells were counted or tracked. (B–E) The quantification of neutrophil and macrophage numbers in tail region by using tlr2 and myd88 zebrafish larvae. Data (mean ± SD) are combined from three pools of zebrafish larvae. No significant differences (ns) in the number of neutrophils (B,D) and macrophages (C,E) was detected with an unpaired, two-tailed t-test. Each point represents one larva and different colors represent different pools. Sample size (n): 28, 32 (B,C); 24, 24 (D,E). (F,G,J,K) Quantification of basal migratory capability in 3 dpf tlr2 zebrafish. The total displacement and mean speed of individual neutrophils (F,J) and macrophages (G,K) were quantified by using a manual tracking plugin. Data (mean ± SD) are combined from 5 larvae of tlr2+/+ Tg (mpeg1:mCherry-F);TgBAC (mpx: EGFP) and tlr2– /– Tg (mpeg1:mCherry-F);TgBAC (mpx: EGFP) larvae, respectively. Each color indicates a different larva. No significant differences (ns) in the total displacement and mean speed of neutrophils (F,J) and macrophages (G,K) were detected with an unpaired, two-tailed t-test. Sample size (n): 28, 28 (F,J); 40, 39 (G,K). Cell tracking movies are shown in Supplementary Movies S1S4) (H,I,L,M) Quantification of basal migratory capability in 3 dpf myd88 zebrafish. The total displacement and mean speed of individual neutrophils (H,L) and macrophages (I,M) were quantified by using a manual tracking plugin. Data (mean ± SD) are combined from 5 larvae of myd88+/+ Tg (mpeg1:mCherry-F);TgBAC (mpx: EGFP) and myd88– /– Tg (mpeg1:mCherry-F);TgBAC (mpx: EGFP) larvae, respectively. Each color indicates a different larva. No significant differences (ns) in the total displacement and mean speed of neutrophils (H,L) and macrophages (I,M) were detected with an unpaired, two-tailed t-test. Sample size (n): 34, 33 (H,L); 47, 55 (I,M). Cell tracking movies are shown in Supplementary Movies S5S8).

Acknowledgments
This image is the copyrighted work of the attributed author or publisher, and ZFIN has permission only to display this image to its users. Additional permissions should be obtained from the applicable author or publisher of the image. Full text @ Front Cell Dev Biol