IMAGE

FIGURE 9

ID
ZDB-IMAGE-210307-56
Source
Figures for Hu et al., 2021
Image
Figure Caption

FIGURE 9

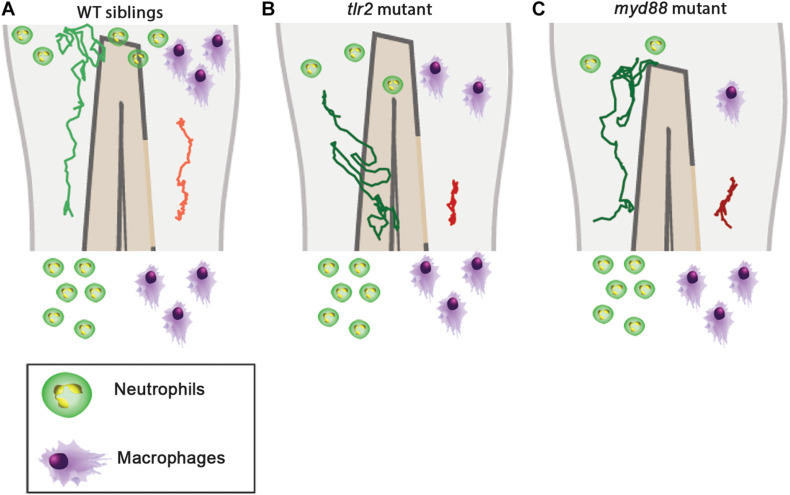
Graphic summary of the data of cell migration behavior in the tlr2 and myd88 mutants and wild type siblings. (A) Cell migration behavior in the wild type siblings. (B) Cell migration behavior in the tlr2 mutant. (C) Cell migration behavior in the myd88 mutant. In all cases, the green and red tracks are representative for the medians of the measured total displacements and net displacements in the anteroposterior axis of distant neutrophils and macrophages, respectively. The number of drawn leukocytes at the wound are only representing estimates of the relative numbers in the different genotypes. For the wild type sibling the tlr2+/+ sibling was used as an example (A).

Acknowledgments
This image is the copyrighted work of the attributed author or publisher, and ZFIN has permission only to display this image to its users. Additional permissions should be obtained from the applicable author or publisher of the image. Full text @ Front Cell Dev Biol