FIGURE

FIGURE 4

ID
ZDB-FIG-210307-46
Publication
Hu et al., 2021 - A Novel Function of TLR2 and MyD88 in the Regulation of Leukocyte Cell Migration Behavior During Wounding in Zebrafish Larvae
Other Figures
All Figure Page
Back to All Figure Page
FIGURE 4

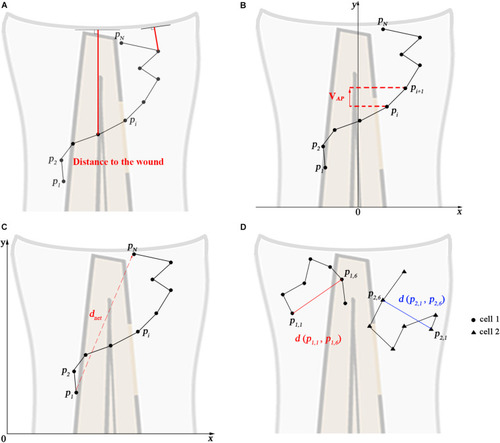
Calculated track measures. (A) Depiction of distance to the wound. It measured for each frame as the shortest distance from the cell’s current position to the entire line of the wound, i.e., the orthogonal projection to the wound. (B) Depiction of VAP: velocity in anteroposterior axis direction. The visible part of the spine is taken as the y-axis. (C) Depiction of the net displacement, total displacement, meandering index, and mean speed: the net displacement is the distance of the cell between the first and final time frame. Total displacement is the sum of the net displacement between two successive frames. Meandering index corresponds to the net displacement divided by the total displacement. Mean speed is the total displacement divided by traveled time. Formulas show in Table 1 (Eqs 1–4). (D) Depiction of the construction of the mean squared displacement: the displacement between the first time frame and time frame t from all cells is squared and averaged (see Table 1, Eq. 5).

Expression Data

Expression Detail
Antibody Labeling
Phenotype Data

Phenotype Detail
Acknowledgments
This image is the copyrighted work of the attributed author or publisher, and ZFIN has permission only to display this image to its users. Additional permissions should be obtained from the applicable author or publisher of the image. Full text @ Front Cell Dev Biol