
- Title
-
Localized EMT reprograms glial progenitors to promote spinal cord repair
- Authors
- Klatt Shaw, D., Saraswathy, V.M., Zhou, L., McAdow, A.R., Burris, B., Butka, E., Morris, S.A., Dietmann, S., Mokalled, M.H.
- Source
- Full text @ Dev. Cell
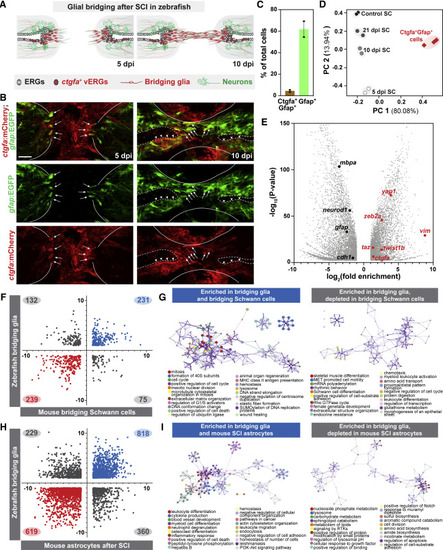
Molecular profiling of bridging glial cells in zebrafish (A) Schematic representation of zebrafish SCs at 5 and 10 dpi. Ependymal radial glial (ERG) progenitors proliferate rostral and caudal to the lesion and the central canal expands proximal to the lesion. ctgfa is expressed in a subset of ERGs at 5 dpi (red) and concentrates to ventral ERGs (vERGs) at 10 dpi. Early bridging glia emerge at 5 dpi and a glial bridge is formed by 10 dpi. (B) mCherry and EGFP in ctgfa:mCherry;gfap:EGFP dual reporter line. Shown are longitudinal SC sections from adult animals at 5 and 10 dpi. For each time point, 10–12 SC sections were analyzed. Lines delineate the outer edges of the SC. Dashed lines outline the central canal. Arrows and arrowheads point to mCherry+EGFP+ bridging glia and vERGs, respectively. (C and D) Capture and deep RNA-seq of bridging glia. ctgfa+gfap+ cells were sorted at 5 dpi. Bulk SC tissues from 5, 10, and 21 dpi, as well as uninjured control SCs were deep sequenced. mCherry+EGFP+ and EGFP+ cells comprised 3% and 60% of total dissociated cells, respectively (C). PCA scatter plot of gene expression shows the variances between biological replicates (D). x and y axes represent the percentages of variation explained by the principal components. (E) Volcano plot representation of genes that are significantly enriched or depleted in sorted ctgfa+gfap+ cells at 5 dpi relative to non-sorted uninjured SC controls. (F–I) Glial cell comparisons between zebrafish ctgfa+gfap+ cells and mammalian glial cells. The transcriptomes of ctgfa+gfap+ cells from zebrafish were cross-referenced with gene expression changes in bridging Schwann cells after nerve injury in mice (F), and in mouse astrocytes after SCI (H). Log2(fold enrichment) for zebrafish and mouse glia are shown on the y and x axes, respectively. Genes that are significantly changed in zebrafish and mice are shown. Genes that are enriched or depleted in both zebrafish and mice are shown in blue and red, respectively. Genes that are differentially changed between zebrafish and mice are shown in gray. Gene ontology analysis was performed on bridging glia enriched genes, subdivided based on their regulation in mouse bridging glia (G) or mouse SCI astrocytes (I). Scale bars, 50 μm. |
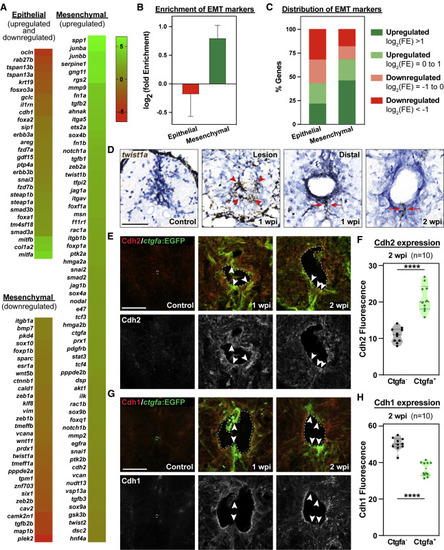
Ventral ependymal progenitors undergo EMT after SCI (A) Expression of EMT-related genes by FACS-seq. Heatmap representation of epithelial and mesenchymal gene expression in ctgfa+gfap+ cells. Color scale in the dendrogram represents log2(fold enrichment) in ctgfa+gfap+ cells relative to control SCs. (B) Enrichment of EMT markers by FACS-seq. Log2(fold enrichment) was averaged for epithelial and mesenchymal genes. (C) Distribution of EMT markers by FACS-seq. Upregulated genes were subdivided into log2(FE) >1 (Green) and log2(FE) = 0 to 1 (Light green). Downregulated genes were subdivided into log2(FE) = −1 to 0 (light red) and log2(FE) < −1 (red). Percent genes within each category are shown. (D) RNAscope for twist1a in wild-type SCs at 1 and 2 wpi, and in uninjured controls. Hematoxylin staining (blue) was used as a counterstain. At 1 wpi, SC cross sections at the lesion site and distal to the lesion from the rostral side are shown. Arrowheads point to twist1a expression at the lesion core at 1 wpi. Arrows point to twist1a expression in ventral ependymal progenitors at 1 and 2 wpi. (E–H) Cdh2 (E) and Cdh1 (G) immunostaining in ctgfa:EGFP zebrafish at 1 and 2 wpi, and in uninjured controls. SC cross sections are shown, and dotted lines delineate central canal edges. Arrowheads point to domains of co-expression of Cdh2 and EGFP (E), and domains of diminished Cdh1 expression and increased EGFP expression (G). Quantification of Cdh2 (F) and Cdh1 (H) expression in ctgfa- and ctgfa+ cells at 2 wpi are shown. ∗∗∗∗p < 0.0001. Scale bars, 50 μm. |
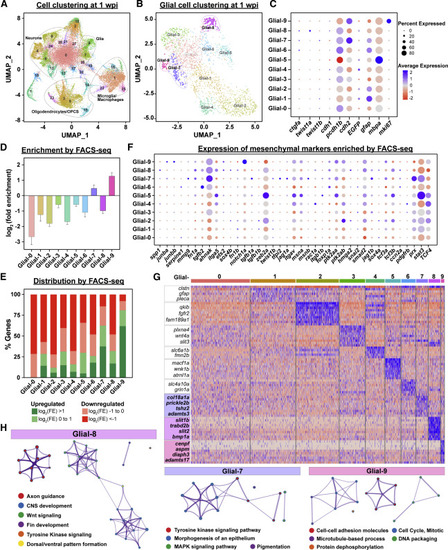
Single cell profiling of glial cells during SC regeneration (A) UMAP of snRNA-seq data from SC tissues at 1 wpi. (B) Sub-clustering and UMAP visualization of glial cell clusters at 1 wpi. Ten clusters of glial cells were identified and termed as Glial-0 to -9. (C) Expression of canonical markers in each glial cluster. Dot colors represent average expression levels from low (red) to high (blue). Dot sizes represent the percent of positive cells for each gene. (D) Enrichment of snRNA-seq-derived glial cell markers by FACS-seq. Glial cell markers were identified for each cluster by snRNA-seq analysis. Log2(fold enrichment) in sorted bridging glia relative to uninjured SCs were then then averaged for each cluster. (E) Distribution of snRNA-seq-derived glial cell markers by FACS-seq. Markers of clusters Glial-0 to -9 were categorized based on their enrichment in ctgfa+gfap+ cells. Upregulated genes were subdivided into log2(FE) > 1 (Green) and log2(FE) = 0 to 1 (Light green). Downregulated genes were subdivided into log2(FE) = −1 to 0 (light red) and log2(FE) < −1 (red). Percent genes within each category are shown. (F) Mesenchymal gene expression in glial clusters. A total of 39 mesenchymal markers that are enriched by FACS-seq are shown. Dot colors represent average expression levels from low (red) to high (blue). Dot sizes represent the percent of positive cells for each gene. (G) Heatmap of genes enriched in clusters Glial-0 to -9. Blue indicates enriched genes and red indicates depleted genes. (H) Gene ontology for markers of clusters Glial-7, -8, and -9. |
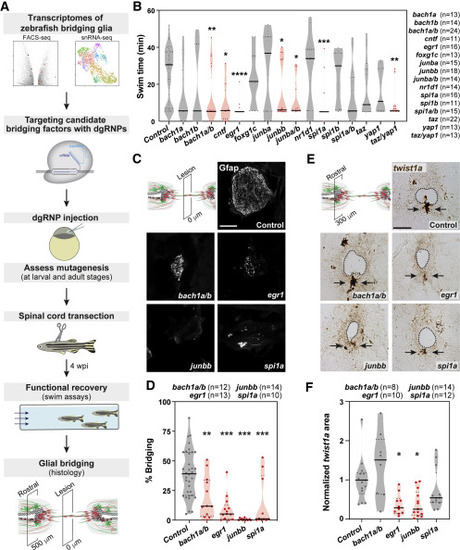
An EMT-driving gene regulatory network directs glial bridging (A) Pipeline for an in vivo CRISPR-Cas9 screen for glial bridging transcription factors. (B) Functional recovery in CRISPR-Cas9-targeted animals 4 wpi. For each group of targeted animals, uninjected siblings were subjected to SCI and swim assays. Dots represent individual animals. Groups with significantly diminished swim function are shown in red. (C and D) Glial bridging in CRISPR-Cas9-targeted animals. Gfap immunohistochemistry was performed at 4 wpi (C). Representative micrographs show Gfap+ bridges at the lesion site in bach1a;bach1b, egr1, junbb, and spi1a-targeted animals. Percent bridging was quantified for 10–14 animals per group (D). (E and F) twist1a expression in CRISPR-Cas9-targeted animals. RNAscope was performed on SC tissues at 4 wpi (E). Dotted lines delineate central canal edges. Arrows point to ventral ependymal progenitors in distal SC sections. Normalized twist1a was quantified from 8–14 sections per group (F). ∗∗∗p < 0.001; ∗∗p < 0.01; ∗p < 0.05. Scale bars, 50 μm. |
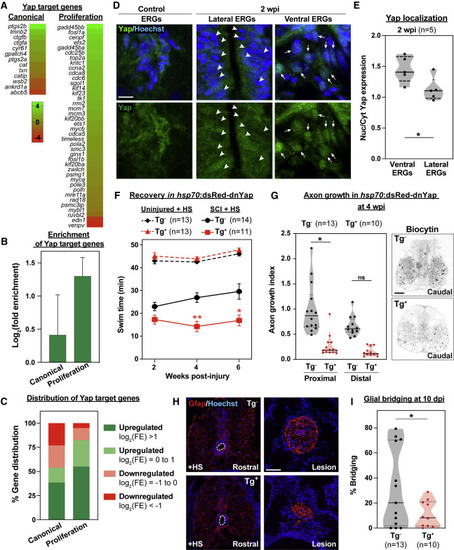
Localized Yap activation promotes glial bridging and SC regeneration (A) Expression of Yap target genes in ctgfa+gfap+ cells. Genes were divided into canonical and proliferative genes. Color scale in the dendrogram represents log2(fold enrichment) by FACS-seq. (B) Enrichment of Yap target genes by FACS-seq. Log2(fold enrichment) was averaged for canonical and proliferative targets. (C) Distribution of Yap target genes by FACS-seq. Canonical and proliferative genes were categorized based on their enrichment in Ctgfa+Gfap+ cells. Upregulated genes were subdivided into log2(FE) > 1 (green) and log2(FE) = 0 to 1 (light green). Downregulated genes were subdivided into log2(FE) = −1 to 0 (light red) and log2(FE) < −1 (red). Percent genes within each category are shown. (D) Yap expression in wild-type zebrafish at 2 wpi and uninjured controls. Lateral and ventral ependymal progenitors are shown in separate panels at 2 wpi. Central canals are constricted in uninjured SCs and expanded proximal to the lesion site after SCI. Arrowheads point to nuclei with attenuated Yap expression in lateral ERGs. Arrows point to nuclei with elevated Yap expression in ventral ERGs. (E) Quantification of Yap expression and localization after SCI. Nuclear and cytoplasmic Yap were quantified in ventral and lateral ependymal domains at 2 wpi. Nuclear-to-cytoplasmic ratios were averaged for 2 sections per animal and 5 animals were used. (F) Swim assays determined motor function recovery of hsp70:dsRed-dnYap (Tg+, SCI, red) and wild-type (Tg−, SCI, black) siblings at 2, 4, and 6 wpi. For controls, dnYap overexpressing (Tg+, uninjured, dashed red) and wild-type (Tg−, uninjured, dashed black) animals were analyzed. All groups were subjected to daily heat shocks. Statistical analyses of swim times are shown for injured dnYap relative to injured wild-type siblings. (G) Anterograde axon tracing in dnYap-expressing zebrafish at 4 wpi. Biocytin axon tracer was applied rostrally and analyzed at 100 μm (proximal) and 500 μm (distal) caudal to the lesion. Representative traces of biocytin are shown for Tg+ and Tg− animals at the proximal level. (H and I) Glial bridging in dnYap-expressing zebrafish. Gfap immunohistochemistry was performed at 10 dpi (H). Representative micrographs show Gfap+ bridges at the lesion site relative to the intact SC in dnYap-expressing (Tg+) and control siblings (Tg−). Percent bridging was quantified for 13 Tg− and 10 Tg+ animals (I) ∗∗p < 0.01; ∗p < 0.05. Scale bars, 10 μm (D) and 50 μm (G and H). |
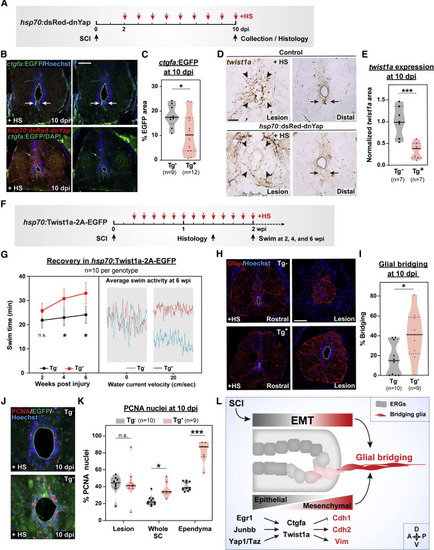
Yap signaling directs twist1a-driven EMT and ctgfa-dependent glial bridging (A–C) ctgfa reporter expression in ctgfa:EGFP;hsp70:dsRed-dnYap (Tg+) SCs. ctgfa:EGFP (Tg−) siblings were used as controls. All animals were subjected to SCI and daily heat shocks (+HS) (A). EGFP expression was assessed at 10 dpi (B). Dotted lines delineate central canal edges. For quantification, the area of EGFP fluorescence was calculated for 2 sections per animal (C). (D and E) twist1a expression in hsp70:dsRed-dnYap and control wild-type siblings. All animals were subjected to daily heat shocks (+HS). RNAscope was performed at 10 dpi (D). Arrowheads point to the lesion core; arrows point to ventral ependymal progenitors in distal SC sections. For quantification, normalized twist1a area was calculated for 2 sections per animal (E). (F and G) Swim assays determined motor function recovery of hsp70:Twist1a-2A-EGFP (Tg+, red) and wild-type (Tg−, black) siblings at 2, 4, and 6 wpi. Both groups were subjected to SCI and daily heat shocks (F). Average swim activities are shown for Twist1a-expressing (Tg+, red) and control animals (Tg−, teal) at 6 wpi in the absence of water current and at a water current velocity of 20 cm/s (G). (H and I) Glial bridging in Twist1a-expressing zebrafish at 10 dpi. Representative immunohistochemistry shows the Gfap+ bridge at the lesion site relative to the intact SC in Twist1a-expressing (Tg+) and control siblings (Tg−) (H). Percent bridging was calculated for 10 Tg− and 9 Tg+ animals (I). (J and K) Cell proliferation in Twist1a-expressing and control siblings. PCNA staining was performed on Tg− and Tg+ animals at 10 dpi (J). Percent PCNA+ cells was quantified for 10 Tg− and 9 Tg+ animals at the lesion, in whole SC tissues, and around the ependyma (K). Percent (L) Schematic Model shows injury-induced EMT regulates ependymal cell reprogramming into bridging glia. Transcriptional modulators Egr1, Junbb, Yap, and Taz direct Ctgfa and Twist1a expression, which then induce the expression of mesenchymal genes, including Cdh2 and Vim, while epithelial markers such as Cdh1 are reduced. ∗∗∗p < 0.001; ∗∗p < 0.01; ∗p < 0.05; ns, not significant. Scale bars, 50 μm. |
Reprinted from Developmental Cell, 56(5), Klatt Shaw, D., Saraswathy, V.M., Zhou, L., McAdow, A.R., Burris, B., Butka, E., Morris, S.A., Dietmann, S., Mokalled, M.H., Localized EMT reprograms glial progenitors to promote spinal cord repair, 613-626.e7, Copyright (2021) with permission from Elsevier. Full text @ Dev. Cell