
Fig. 1
- ID
- ZDB-FIG-210413-34
- Publication
- Klatt Shaw et al., 2021 - Localized EMT reprograms glial progenitors to promote spinal cord repair
- Other Figures
- All Figure Page
- Back to All Figure Page
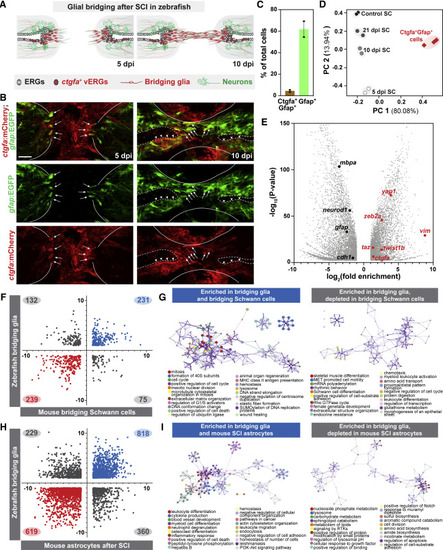
Molecular profiling of bridging glial cells in zebrafish (A) Schematic representation of zebrafish SCs at 5 and 10 dpi. Ependymal radial glial (ERG) progenitors proliferate rostral and caudal to the lesion and the central canal expands proximal to the lesion. ctgfa is expressed in a subset of ERGs at 5 dpi (red) and concentrates to ventral ERGs (vERGs) at 10 dpi. Early bridging glia emerge at 5 dpi and a glial bridge is formed by 10 dpi. (B) mCherry and EGFP in ctgfa:mCherry;gfap:EGFP dual reporter line. Shown are longitudinal SC sections from adult animals at 5 and 10 dpi. For each time point, 10–12 SC sections were analyzed. Lines delineate the outer edges of the SC. Dashed lines outline the central canal. Arrows and arrowheads point to mCherry+EGFP+ bridging glia and vERGs, respectively. (C and D) Capture and deep RNA-seq of bridging glia. ctgfa+gfap+ cells were sorted at 5 dpi. Bulk SC tissues from 5, 10, and 21 dpi, as well as uninjured control SCs were deep sequenced. mCherry+EGFP+ and EGFP+ cells comprised 3% and 60% of total dissociated cells, respectively (C). PCA scatter plot of gene expression shows the variances between biological replicates (D). x and y axes represent the percentages of variation explained by the principal components. (E) Volcano plot representation of genes that are significantly enriched or depleted in sorted ctgfa+gfap+ cells at 5 dpi relative to non-sorted uninjured SC controls. (F–I) Glial cell comparisons between zebrafish ctgfa+gfap+ cells and mammalian glial cells. The transcriptomes of ctgfa+gfap+ cells from zebrafish were cross-referenced with gene expression changes in bridging Schwann cells after nerve injury in mice (F), and in mouse astrocytes after SCI (H). Log2(fold enrichment) for zebrafish and mouse glia are shown on the y and x axes, respectively. Genes that are significantly changed in zebrafish and mice are shown. Genes that are enriched or depleted in both zebrafish and mice are shown in blue and red, respectively. Genes that are differentially changed between zebrafish and mice are shown in gray. Gene ontology analysis was performed on bridging glia enriched genes, subdivided based on their regulation in mouse bridging glia (G) or mouse SCI astrocytes (I). Scale bars, 50 μm. |
Reprinted from Developmental Cell, 56(5), Klatt Shaw, D., Saraswathy, V.M., Zhou, L., McAdow, A.R., Burris, B., Butka, E., Morris, S.A., Dietmann, S., Mokalled, M.H., Localized EMT reprograms glial progenitors to promote spinal cord repair, 613-626.e7, Copyright (2021) with permission from Elsevier. Full text @ Dev. Cell