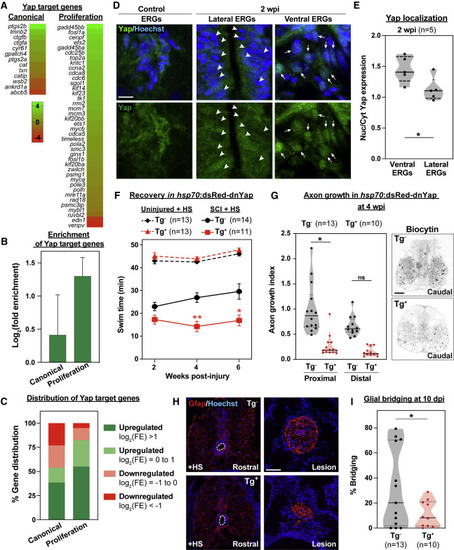
Localized Yap activation promotes glial bridging and SC regeneration (A) Expression of Yap target genes in ctgfa+gfap+ cells. Genes were divided into canonical and proliferative genes. Color scale in the dendrogram represents log2(fold enrichment) by FACS-seq. (B) Enrichment of Yap target genes by FACS-seq. Log2(fold enrichment) was averaged for canonical and proliferative targets. (C) Distribution of Yap target genes by FACS-seq. Canonical and proliferative genes were categorized based on their enrichment in Ctgfa+Gfap+ cells. Upregulated genes were subdivided into log2(FE) > 1 (green) and log2(FE) = 0 to 1 (light green). Downregulated genes were subdivided into log2(FE) = −1 to 0 (light red) and log2(FE) < −1 (red). Percent genes within each category are shown. (D) Yap expression in wild-type zebrafish at 2 wpi and uninjured controls. Lateral and ventral ependymal progenitors are shown in separate panels at 2 wpi. Central canals are constricted in uninjured SCs and expanded proximal to the lesion site after SCI. Arrowheads point to nuclei with attenuated Yap expression in lateral ERGs. Arrows point to nuclei with elevated Yap expression in ventral ERGs. (E) Quantification of Yap expression and localization after SCI. Nuclear and cytoplasmic Yap were quantified in ventral and lateral ependymal domains at 2 wpi. Nuclear-to-cytoplasmic ratios were averaged for 2 sections per animal and 5 animals were used. (F) Swim assays determined motor function recovery of hsp70:dsRed-dnYap (Tg+, SCI, red) and wild-type (Tg−, SCI, black) siblings at 2, 4, and 6 wpi. For controls, dnYap overexpressing (Tg+, uninjured, dashed red) and wild-type (Tg−, uninjured, dashed black) animals were analyzed. All groups were subjected to daily heat shocks. Statistical analyses of swim times are shown for injured dnYap relative to injured wild-type siblings. (G) Anterograde axon tracing in dnYap-expressing zebrafish at 4 wpi. Biocytin axon tracer was applied rostrally and analyzed at 100 μm (proximal) and 500 μm (distal) caudal to the lesion. Representative traces of biocytin are shown for Tg+ and Tg− animals at the proximal level. (H and I) Glial bridging in dnYap-expressing zebrafish. Gfap immunohistochemistry was performed at 10 dpi (H). Representative micrographs show Gfap+ bridges at the lesion site relative to the intact SC in dnYap-expressing (Tg+) and control siblings (Tg−). Percent bridging was quantified for 13 Tg− and 10 Tg+ animals (I) ∗∗p < 0.01; ∗p < 0.05. Scale bars, 10 μm (D) and 50 μm (G and H).
|
