FIGURE SUMMARY
Title

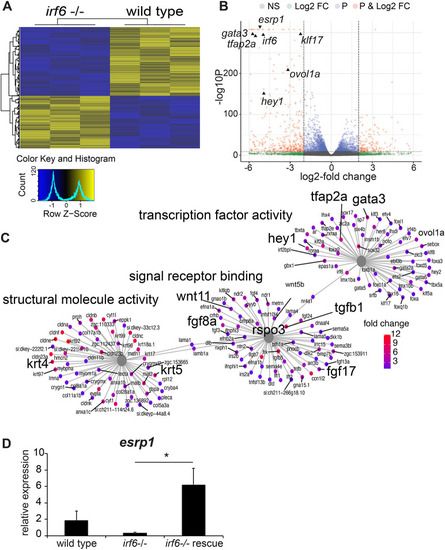
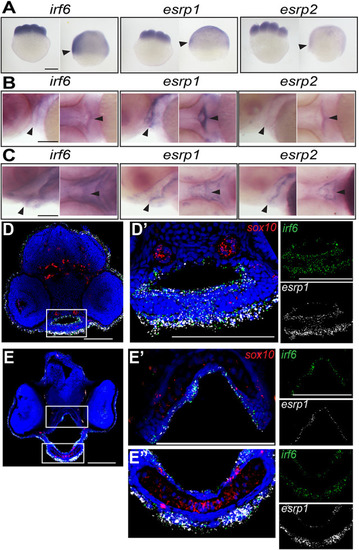
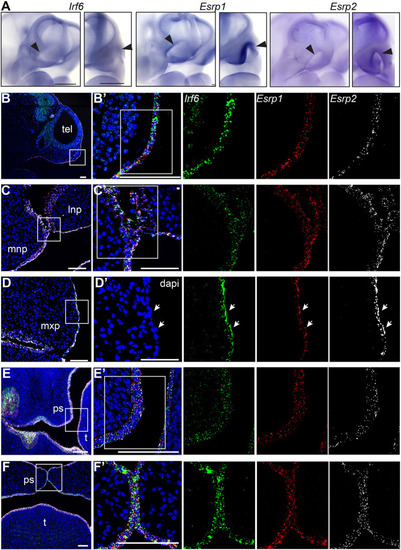
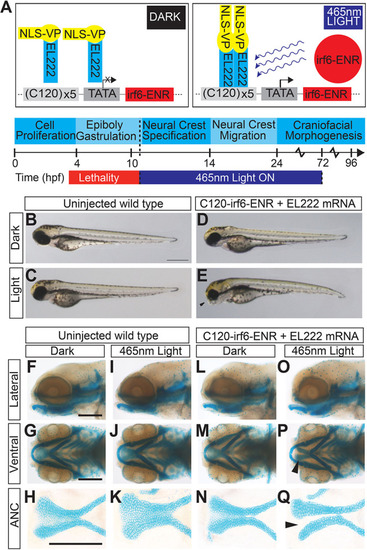
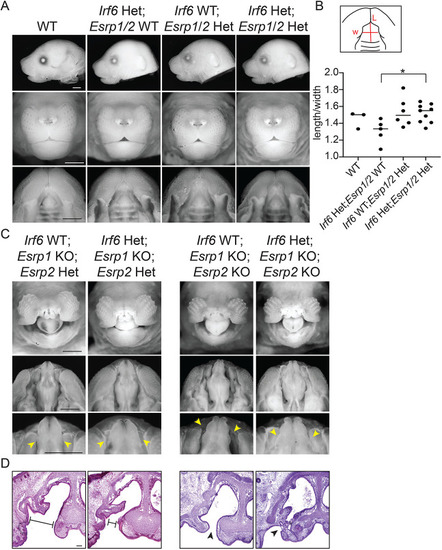
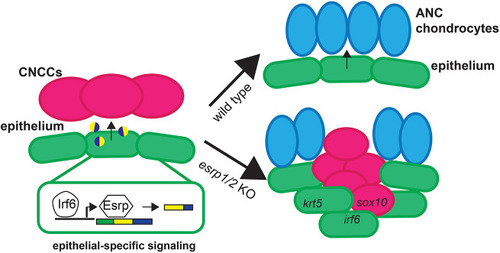
An Irf6-Esrp1/2 regulatory axis controls midface morphogenesis in vertebrates

Authors
Carroll, S.H., Macias Trevino, C., Li, E.B., Kawasaki, K., Myers, N., Hallett, S.A., Alhazmi, N., Cotney, J., Carstens, R.P., Liao, E.C.
Source
Full text @ Development

esrp1 expression is downregulated in irf6 null zebrafish embryos. (A) Hierarchical clustering of top differentially expressed genes (DEGs) defined by RNA-seq performed on wild-type (WT) versus mz-irf6-8bp/-8bp (irf6−/−) zebrafish embryos at 4-5 hpf. Top DEGs were identified by selecting genes with an adjusted P-value (Benjamini–Hochberg) <0.01 and absolute log2-fold change >2. Data are shown for three biological replicates. Color scale on the bottom left represents relative levels of expression, with yellow showing higher expression levels and blue showing lower expression. (B) Volcano plot from the RNA-seq dataset, showing the distribution of DEGs based on P-values (P) and log2-fold change (Log2 FC). NS, not significant. Previously published irf6-regulated genes are expressed at significantly higher levels in WT relative to mz-irf6−/−, including grhl3, klf17 and wnt11. The newly identified cleft-associated gene esrp1 is also expressed significantly higher in WT relative to irf6−/−. Vertical dashed lines represent the P-value cutoff of 0.01 and the log2-fold change cutoff of 2, respectively. (C) Gene ontology (GO) gene-concept network analysis of RNA-seq data, showing that irf6−/− embryos have perturbations in processes such as transcription factor activity, signal receptor binding and structural molecule activity. Note that many of these genes – such as wnt11, fgf8, tgfb1, krt4 and krt5 – are implicated in ectoderm development and cell specification. Gray nodes show GO terms, colored nodes show individual genes from the RNA-seq dataset, and black lines connect genes to one or more associated GO terms. Colored nodes show relative enrichment (measured by fold change) of genes in WT samples relative to irf6−/− embryos. Maps were generated using the enrichplot package in R. (D) qPCR gene expression analysis for esrp1, showing ∼80% downregulation in mz-irf6-8bp/-8bp embryos compared with WT at 4 hpf, and rescued esrp1 gene overexpression in mz-irf6-8bp/-8bp embryos injected with WT zebrafish irf6 mRNA. n=4. Unpaired Student’s t-test, *P<0.05.

EXPRESSION / LABELING:
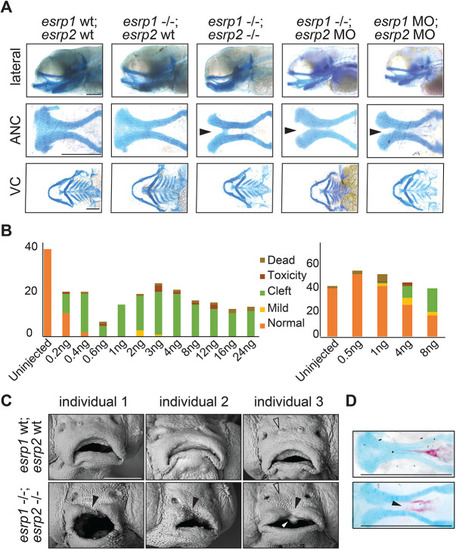
Genes:
Fish:
Anatomical Term:
Stage Range: Sphere to 30%-epiboly
PHENOTYPE:
Fish:
Observed In:
Stage Range: Sphere to 30%-epiboly

irf6,esrp1 and esrp2 are co-expressed in the oral epithelium of zebrafish embryos. (A-C) Whole-mount in situ hybridization (WISH), showing that irf6, esrp1 and esrp2 maternal deposited transcripts are detected at the eight-cell and shield stage (A; arrowheads indicate periderm), and circumscribe the developing stomodeum and line the oral epithelium of zebrafish embryos at 48 (B) and 72 (C) hpf (arrowheads). All whole-mount embryos are oriented with anterior left and dorsal top. (D-E″) Coronal sections of 48 (D) and 72 (E) hpf embryos analyzed by RNAscope in situ hybridization (ISH), (dorsal top), showing cellular RNA co-expression of irf6 (green) and esrp1 (white) in surface and oral epithelial cells. sox10 (red) staining depicts cartilage elements of the palate. Boxed areas are shown at higher magnification in D′, E′ and E″. Scale bars: 250 μm (A) and 100 μm (B-E″).

Irf6, Esrp1 and Esrp2 are co-expressed in the oral epithelium of mouse embryos. (A) WISH of E10.5 embryos, showing Irf6, Esrp1 and Esrp2 mRNA expression in the surface epithelium and concentrated within the ectoderm of the frontonasal prominences (arrowheads) and first brachial arch. Oblique and frontal orientation. Scale bars: 500 μm. (B-F′) Sections of E10 (B,B′), E11.5 (C-D′), E13.5 (E,E′) and E15 (F,F′) embryos analyzed by RNAscope ISH, showing mRNA cellular co-expression of Irf6 (green), Esrp1 (red) and Esrp2 (white) in the surface ectoderm (E10), lining the frontonasal and maxillary prominences, including expression in periderm (arrows) (E11.5), and lining the palatal shelves (E13.5, E15). Sagittal (B,B′) and coronal (C-F′) sections; boxed areas are shown at higher magnification in B′, C′, D′, E′ and F′. dapi, 4′,6-diamidino-2-phenylindole; lnp, lateral nasal prominence; mnp, medial nasal prominence; mxp, maxillary prominence; ps, palate shelf; t, tongue; tel, telencephalon. Scale bars: 100 μm.

EL222 optogenetic disruption of irf6 circumvents early embryonic lethality and causes a cleft palate phenotype. (A) Schematic of EL222 optogenetic system. VP16-EL222 monomers are inactive under dark conditions. Upon stimulation by 465 nm light, VP16-EL222 dimerizes, drives gene expression downstream of the C120 promoter and induces the expression of a dominant-negative form of irf6 (irf6-ENR). Embryos were exposed to blue light from 10 hpf to 72 hpf to circumvent embryonic lethality in mz-irf6-8bp/-8bp embryos. (B-E) Brightfield microscopy of 72 hpf zebrafish embryos injected with the optogenetic system and grown in the dark (D) or exposed to blue light from 10-72 hpf (E) compared with control injected embryos (B,C). Injected fish exposed to blue light exhibit retrusion of the midface (arrowhead) and a curved body not observed in the other groups. (F-Q) Alcian Blue staining of cartilage and microdissection of the palate of 72 hpf embryos reveals a midface retrusion and cleft phenotype through the medial ethmoid plate (arrowhead in P, Q) in the C120-irf6-ENR-injected embryos grown under blue light (O-Q), which is not seen in control injected embryos (I-K) or injected embryos grown in the dark (L-N). Scale bars: 150 µm.

esrp1/2 double mutants display a cleft lip and palate. (A) Alcian Blue staining of 4 dpf zebrafish. Representative images of WT, esrp1 CRISPR mutant (esrp1−/−) and esrp1/2 double CRISPR mutant (esrp1−/−; esrp2−/−), as well as esrp1 CRISPR mutant treated with esrp2 morpholino and WT treated with esrp1 and esrp2 morpholino (esrp1 MO, esrp2 MO). Flat-mount images of the anterior neurocranium (ANC) show a cleft (arrowheads) between the median element and lateral element of the ANC when both esrp1 and esrp2 function were disrupted. Lateral images and flat-mount images of the ventral cartilage (VC) show only subtle changes in morphology between WT and esrp1/2−/− zebrafish. (B) Morphant phenotypes observed over a range of esrp1 and esrp2 MO doses. Single esrp2 MO injections in the esrp1−/− background achieves nearly 100% phenotype penetrance, even at very low MO doses. (C) SEM of 5 dpf zebrafish showing discontinuous upper lip (filled arrowheads) in the esrp1/2 double CRISPR mutant as well as absent preoptic cranial neuromasts (open arrowheads) and abnormal keratinocyte morphology. The white arrowhead indicates an aberrant cell mass. (D) Representative images of Alizarin Red/Alcian Blue staining of 9 dpf esrp1/2 double CRISPR mutant zebrafish and WT clutch-mate controls. Esrp1/2 ablation causes abnormal morphology of the mineralizing parasphenoid bone; the bone appears wider and with a cleft (arrowhead). Scale bars: 150 µm (A,D); 100 µm (C).

esrp1/2 null cranial neural crest cells(CNCCs)migrate to the ANC but do not differentiate to chondrocytes. (A) Lineage tracing of WT or esrp1/2 morphant zebrafish embryos using the Tg(sox10:kaede) line, native Kaede fluorescence is shown in green, and photo-converted Kaede is shown in magenta. Sagittal and horizontal views of zebrafish embryos at 19 hpf and 4.5 dpf, respectively. The anteriormost neural crest frontonasal prominence (FNP) progenitors were photoconverted at 19 hpf. At 4.5 dpf, the WT signal tracks to the medial portion of the ANC. Both the esrp1/esrp2 double CRISPR mutants and esrp1/2 morphants exhibit a cleft in the ANC with absence of a portion of sox10+ cells in the medial portion of the ANC, but the labeled CNCCs representing FNP progenitors did reach and populate the entire length of the ANC. (B) Illustrative summary of lineage tracing results showing that photo-converted anteriormost CNCCs contributing to FNP do migrate into the ANC in esrp1/2 mutant embryos, but a cleft forms at the juxtaposition of the FNP-derived median element and the maxillary-derived lateral element. Scale bars: 150 µm.

ANC of esrp1/2 double mutants is populated by undifferentiated cells. Representative z-stacks of RNAscope ISH of coronal sections of esrp1/2 double CRISPR mutants and WT clutch-mate controls at 4 dpf. (A) Sections through ANC anterior to the eyes. col2a1 (red) staining depicts normal morphology of the ANC cartilage elements in WT, while a cleft is apparent in the esrp1/2−/− zebrafish, with dapi (blue)-stained cells between adjacent trabeculae (arrowheads). These col2a1 cells do not express epithelial markers krt4 (cyan) or krt5 (magenta), except around the periphery. (B) Sections posterior to those in A show col2a1 cells continuing inferior to the trabeculae in the esrp1/2 mutant zebrafish, and cells have low expression of irf6 (boxed area). (C) Zoomed image of col2a1 cells from the boxed area in B, showing irf6 expression (green). Dashed lines outline ANC cartilage elements. Scale bars: 50 μm.

Aberrant ANC cells of esrp1/2 double mutants express CNCC and epithelial cell markers. Representative z-stacks of RNAscope ISH of coronal sections of esrp1/2 double CRISPR mutants and WT clutch-mate controls at 4 dpf. (A) Sections through the ANC anterior to the eyes. (B) Medial sagittal sections through the ANC (anterior to left). Dashed lines outline the ANC cartilage elements. col1a1 (white) staining depicts perichondrium surrounding the aberrant mass of cells in the esrp1/2 mutant zebrafish, consistent with chondrogenic condensation (leftmost arrowhead). irf6 (green) and sox10 (red) expression is apparent in these cells (indicated by arrowheads in respective columns); dapi is shown in blue. Scale bars: 20 μm.

Irf6 and Esrp1/2 interact to modify palate phenotypes. Mice compound heterozygous for Irf6R84C, Esrp1 and Esrp2 were generated by breeding Irf6R84C/+ with Esrp1+/−; Esrp2−/− mice. The triple heterozygotes were then inter-crossed and embryos were collected at E18.5. (A) Representative lateral, frontal and oral images of embryos, comparing WT (Irf6+/+; Esrp1+/+; Esrp2+/+), Irf6R84C heterozygote (Het) (Irf6R84C/+; Esrp1+/+; Esrp2+/+), Esrp1/2 double heterozygote (Irf6+/+; Esrp1+/−; Esrp2+/−) and triple heterozygote (Irf6R84C/+; Esrp1+/−; Esrp2+/−). (B) Measurements of palate length (L) relative to width (W). Irf6R84C/+ embryos tend to have a shorter palate compared with WT; however this genotype on an Esrp1+/−; Esrp2+/− background results in significantly increased palate length relative to Irf6R84C/+; Esrp1+/+; Esrp2+/+ (one-way ANOVA, *P<0.05; n=3,5,6,9). (C) Representative frontal and oral images of embryos, comparing Irf6+/+; Esrp1−/−; Esrp2+/− with Irf6R84C/+; Esrp1−/−; Esrp2+/− and Irf6+/+; Esrp1−/−; Esrp2/− with Irf6R84C/+; Esrp1−/−; Esrp2−/−. Scale bars: 50 μm. (D) Hematoxylin and Eosin staining of coronal sections through the vomeronasal cavity and primary palate of the same embryos. Irf6R84C heterozygosity modifies the Esrp1 knockout (KO) and Esrp1/2 double KO cleft lip and palate such that the cleft space between adjacent elements is narrower (arrowheads; C,D), and, in some cases, we noticed epithelial adhesions that limited the cleft. Scale bars: 100 μm.

Illustrative summary of results. Ablation of the epithelial-restricted splicing factors esrp1 and esrp2 led to the dysregulation of CNCC integration and differentiation in the medial ANC, causing a cleft between lateral ANC elements. These results suggest that epithelial-specific splice variants of yet to be determined factors are required for directing the juxtaposed mesenchymal-derived cells and promoting normal morphogenesis.

ZFIN is incorporating published figure images and captions as part of an ongoing project. Figures from some publications have not yet been curated, or are not available for display because of copyright restrictions.

Acknowledgments
This image is the copyrighted work of the attributed author or publisher, and ZFIN has permission only to display this image to its users. Additional permissions should be obtained from the applicable author or publisher of the image. Full text @ Development