
- Title
-
Vitamin D deficiency serves as a precursor to stunted growth and central adiposity in zebrafish
- Authors
- Knuth, M.M., Mahapatra, D., Jima, D., Wan, D., Hammock, B.D., Law, M., Kullman, S.W.
- Source
- Full text @ Sci. Rep.

ZFIN is incorporating published figure images and captions as part of an ongoing project. Figures from some publications have not yet been curated, or are not available for display because of copyright restrictions. PHENOTYPE:
|
|
ZFIN is incorporating published figure images and captions as part of an ongoing project. Figures from some publications have not yet been curated, or are not available for display because of copyright restrictions. PHENOTYPE:
|
VDD in male 6 mpf zebrafish fed a vitamin D null diet. ( |
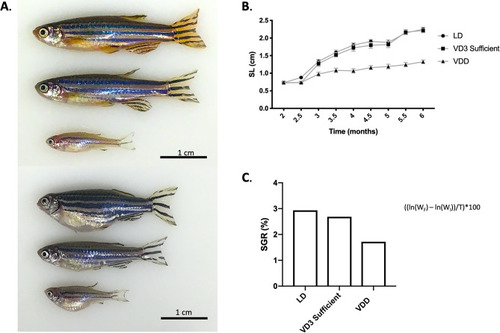
Stunted growth observed in the VDD zebrafish 6 mpf. ( PHENOTYPE:
|
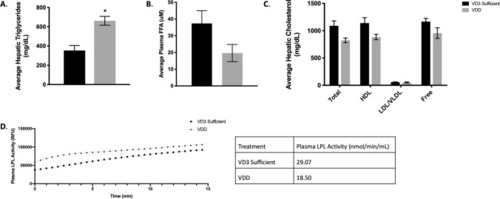
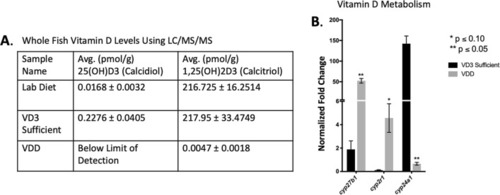
Metabolic homeostasis in VDD liver. ( PHENOTYPE:
|
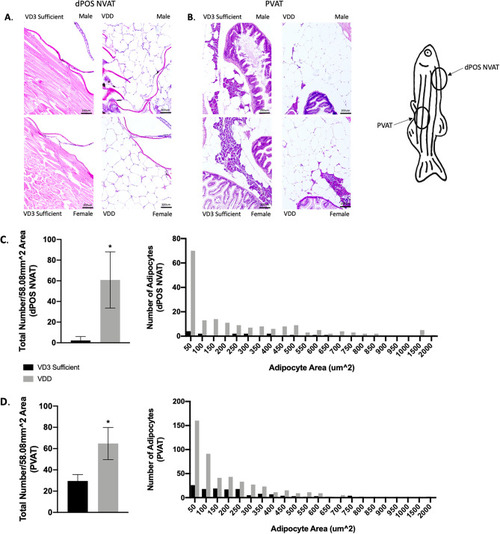
VDD fish demonstrated both hypertrophy and hyperplasia of dorsal paraosseal (dPOS) non-visceral AT (NVAT) and pancreatic visceral AT (PVAT) PHENOTYPE:
|
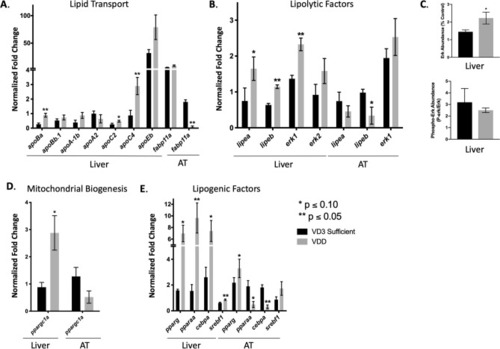
Metabolic dyshomeostasis in VDD AT. ( |
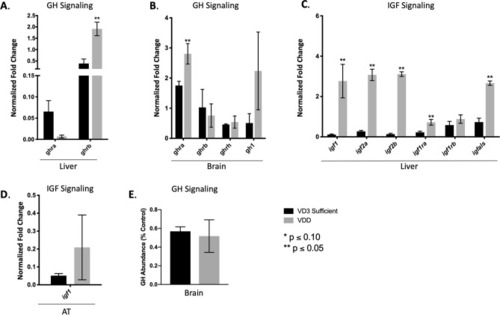
Evaluating GH signaling in VDD liver, AT, and brain. ( |
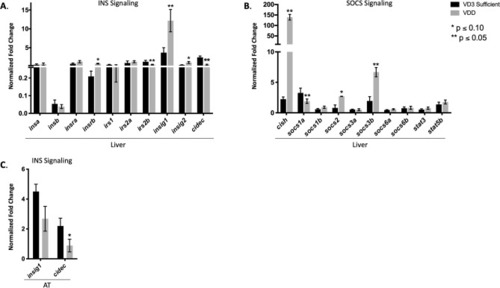
Evaluating INS signaling in VDD liver and AT. ( |
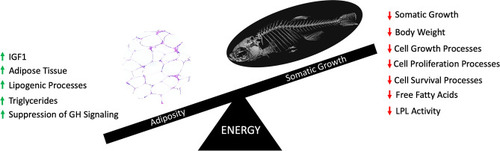
Summarizing the impact of VDD. VDD during early life stage development leads to metabolic dyshomeostasis, where there is an imbalance between somatic growth and adiposity. |