IMAGE

Figure 4

ID
ZDB-IMAGE-201003-54
Source
Figures for Knuth et al., 2020
Image
Figure Caption

Figure 4

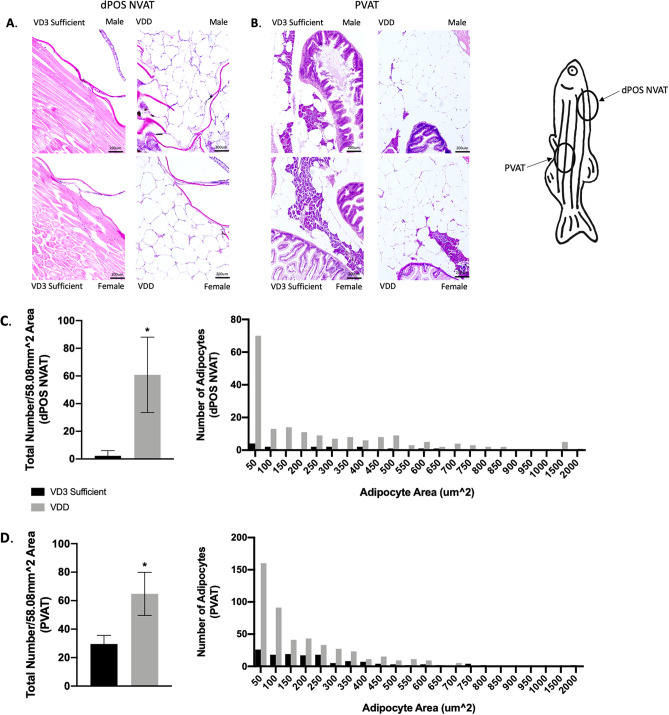
VDD fish demonstrated both hypertrophy and hyperplasia of dorsal paraosseal (dPOS) non-visceral AT (NVAT) and pancreatic visceral AT (PVAT)31. (A) Representative images of dPOS NVAT (58.08 mm2 area). (B) Representative images of PVAT (58.08 mm2 area). (C) VDD fish had hypertrophic and hyperplastic (60.78 ± 9.09 adipocytes) dPOS NVAT compared to VD3 sufficient 6 mpf. Data are represented as mean ± SEM (n = 9). (D) VDD fish had hypertrophic and hyperplastic (64.75 ± 15.11 adipocytes) PVAT compared to VD3 sufficient 6 mpf. Data are represented as mean ± SEM (n = 9).

Figure Data
Acknowledgments
This image is the copyrighted work of the attributed author or publisher, and ZFIN has permission only to display this image to its users. Additional permissions should be obtained from the applicable author or publisher of the image. Full text @ Sci. Rep.