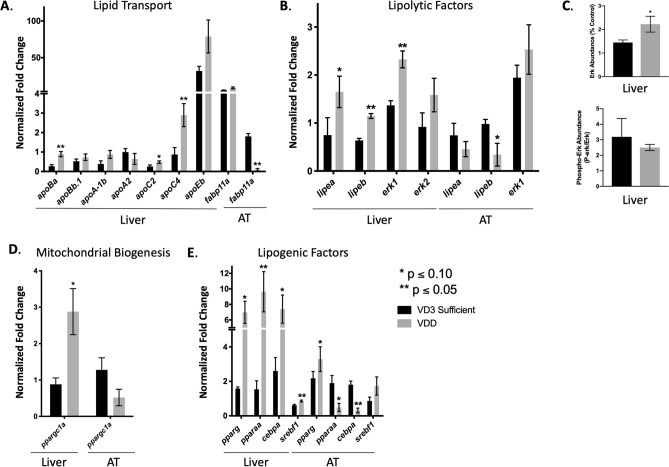
Image
Figure Caption

Figure 5

Metabolic dyshomeostasis in VDD AT. (A) Elevated expression of lipid transporters in VDD liver 6 mpf. Decreased expression of fabp11a in VDD AT 6 mpf. (B) Elevated expression of lypolitic factors in VDD liver 6 mpf, with a decrease in lipea and lipeb in VDD AT. (C) Greater abundance of erk1/2 protein in VDD liver 6 mpf, with a decreased in p-erk1/2. (D) Suppression of mitochondrial biogenesis in VDD AT compared to VDD liver 6 mpf. (E) Elevated expression of lipogenic factors in VDD liver 6 mpf. Elevated expression of pparg and srebf1 in VDD AT 6 mpf with a decrease in pparaa and cebpa. *See also Figure S3.

Figure Data
Acknowledgments
This image is the copyrighted work of the attributed author or publisher, and ZFIN has permission only to display this image to its users. Additional permissions should be obtained from the applicable author or publisher of the image. Full text @ Sci. Rep.