
- Title
-
Non-thalamic origin of zebrafish sensory nuclei implies convergent evolution of visual pathways in amniotes and teleosts
- Authors
- Bloch, S., Hagio, H., Thomas, M., Heuzé, A., Hermel, J.M., Lasserre, E., Colin, I., Saka, K., Affaticati, P., Jenett, A., Kawakami, K., Yamamoto, N., Yamamoto, K.
- Source
- Full text @ Elife
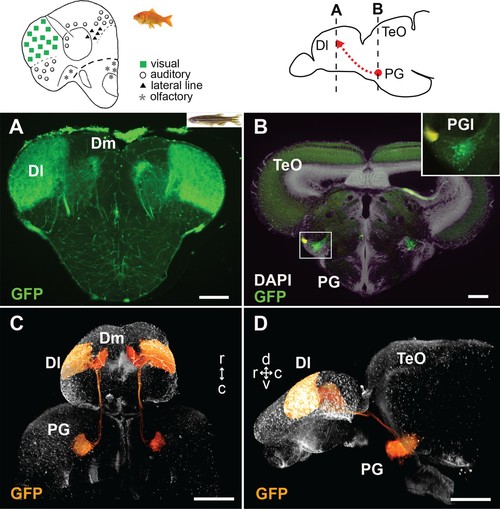
GFP+ afferents in Tg(279A-GFP) zebrafish transgenic line.(A and B) Frontal sections of Tg(279A-GFP) adult brain showing the GFP+ fibers in Dl of the pallium (A), and GFP+ cell bodies in PG (more specifically, PGl; B). The levels of the frontal sections are indicated on the schematic drawing of a lateral view of the brain (upper right). (A) Abundant GFP+ fibers are found in the zebrafish Dl, which corresponds to the main visual area in the goldfish pallium (upper left schematic drawing adapted from Yamamoto, 2009). (B) A brain section at the level of PG. Higher magnification of the right side of PG is shown in the inset. Based on the nomenclature from goldfish, we define the GFP+ PG cell cluster projecting to the Dl as PGl in the present study. (C and D) Selected visualization of the GFP+ projections from PGl to the pallium. After 3D reconstruction of the whole brain imaging of Tg(279A-GFP), the GFP+ signal of the PGl cells was selectively visualized in order to follow their projections (see Materials and methods). C shows the dorsal view of the brain and D shows the lateral view. The original movie is shown in Video 1. Abbreviations: Dl, lateral part of dorsal telencephalic area; Dm, medial part of dorsal telencephalic area; PG, preglomerular complex; PGl, lateral preglomerular nucleus; TeO, optic tectum. Brain orientation: r, rostral; c, caudal; d, dorsal; v, ventral. Scale bars = 100 µm (A and B); 500 µm (C and D). |
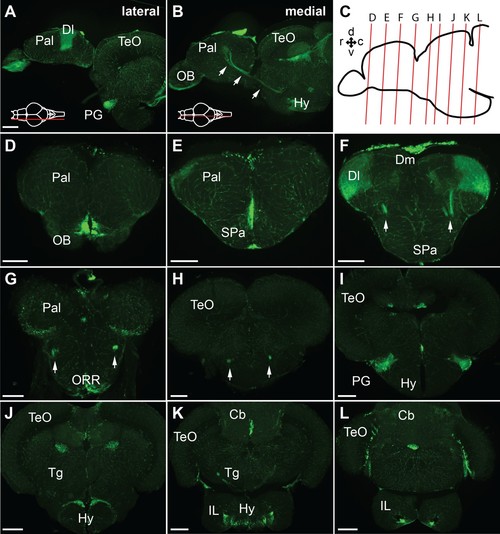
GFP expression of the Tg(279A-GFP) adult brain.(A and B) Sagittal sections of the Tg(279A-GFP) adult brain (anterior to the left). A is a more lateral section showing the PG and Dl, and B is a more medial section showing the PG axons coursing to the Dl (arrows). (C) Schematic drawing of a sagittal section indicating the level of the frontal sections shown in (D–L). (D–L) Frontal sections of the Tg(279A-GFP) adult brain from anterior to posterior. The PG-pallial projection fibers are indicated with arrows in (F), (G), and (H). Note that the GFP expression is not exclusive to the PG-pallial projection neurons, but some other structures such as the olfactory bulb (OB) and the hypothalamus (Hy) are also labeled. Abbreviations: Cb, cerebellum; Dl, lateral part of dorsal telencephalic area; Dm, medial part of dorsal telencephalic area; IL, inferior lobe; Hy, hypothalamus; OB, olfactory bulb; ORR, optic recess region; Pal, pallium; PG, preglomerular complex; SPa, subpallium; TeO, optic tectum; Tg, tegmentum. Brain orientation: r, rostral; c, caudal; d, dorsal; v, ventral. Scale bars,=200 µm. |
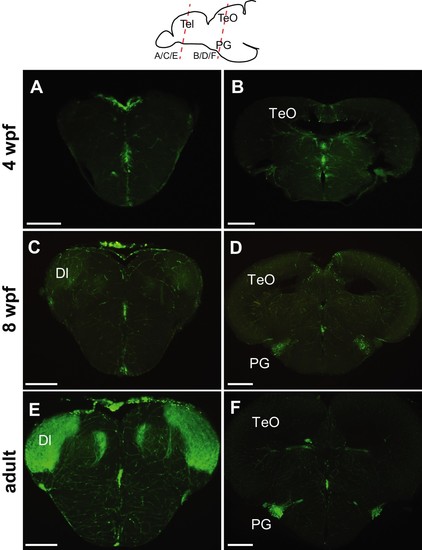
Progression of GFP expression in the Tg(279A-GFP) brain during development.Frontal sections of 4 wpf (A and B), 8 wpf (C and D), and the adult (E and F) brains at the level of the telencephalon (A, C, and E) and PG (B, D, and F). Approximate antero-posterior levels are indicated in the schematic drawing on the top. At 4 wpf, there is no GFP+ fiber in the Dl (A) nor GFP+ cell around the PG (B). The GFP+ cells (presumably in the PGl) become obvious at 8 wpf (D), but their fiber labeling in the Dl is significantly weaker (C) in comparison to the adult (E). Abbreviations: Dl, lateral part of dorsal telencephalic area; PG, preglomerular complex; TeO, optic tectum. Scale bar = 200 µm. |
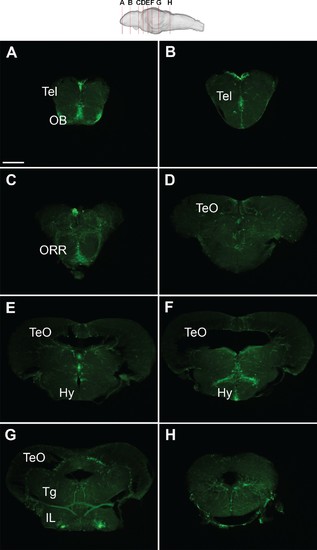
GFP expression of the Tg(279A-GFP) brain at 4 wpf.Frontal sections of the juvenile brain from anterior to posterior. Approximate levels of frontal sections are indicated in the schematic drawing on the top. The PGl-Dl projection is not observable at this stage. Abbreviations: IL, inferior lobe; Hy, hypothalamus; OB, olfactory bulb; ORR, optic recess region; Tel, telencephalon; TeO, optic tectum; Tg, tegmentum. Scale bar = 200 µm. |
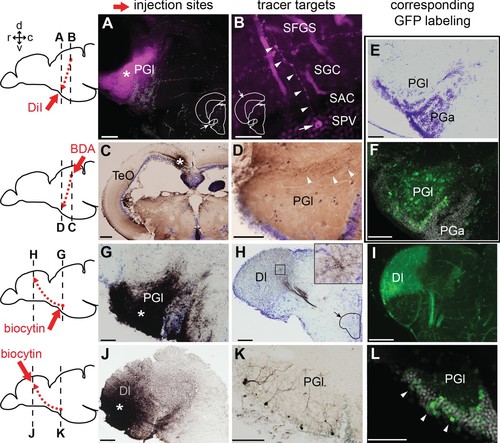
Tract-tracing study showing connections of the lateral preglomerular nucleus (PGl).Schematic drawings indicate the injection site of each tracer and levels of the frontal sections shown on the right panels. In all the frontal sections shown in A-L, the lateral side of the brain is to the left. (A–F) PGl receiving tectal inputs. (A and B) DiI retrograde labeling (magenta), showing the injection site in the PGl (A; asterisk), and a retrogradely labeled neuron (B; arrow) located in a deep layer (SPV) of the optic tectum (TeO). This neuron extends its dendrites (B; arrowheads) to the upper layer (SFGS) where retinal projections terminate. (C and D) BDA anterograde labeling (brown) showing the injection site in TeO (C; asterisk) and anterogradely labeled terminals in the ipsilateral PGl (D; arrowheads). (E) Cresyl violet staining showing the cytoarchitecture of the zebrafish PG: the lateral (PGl) and the anterior (PGa) subdivisions can be identified, based on the comparison with the goldfish PG (the nomenclature applied from goldfish; Yamamoto and Ito, 2008). (F) GFP+ labeling in the PG of Tg(279A-GFP) zebrafish line (20 µm projection of confocal images; GFP in green and DAPI in grey), showing a section comparable to the level shown in (E). GFP+ perikarya are mostly found in PGl. (G–L) PGl neurons projecting to Dl of the pallium. (G and H) Biocytin injection site in the PGl (G; asterisk) and anterogradely labeled terminals in the ipsilateral Dl (H). The right top inset in (H) shows a higher magnification of the squared area showing numerous labeled terminals. (I) GFP+ fiber labeling in the Dl of Tg(279A-GFP) zebrafish line, demonstrating an arborization pattern comparable to the anterograde biocytin labeling shown in (H). (J and K) Biocytin injection site in the Dl (J; asterisk), and retrogradely labeled neurons in the ipsilateral PGl (K) that extend dendrites ramifying in the neuropil. (L) GFP+ perikarya labeling in the PGl of Tg(279A-GFP) zebrafish line (arrowheads; 5 µm projection), demonstrating the almost identical cell localization as shown in (K). Abbreviations: Dl, lateral part of dorsal telencephalic area; PGa, anterior preglomerular nucleus; PGl, lateral preglomerular nucleus; SAC, stratum album centrale; SFGS, stratum fibrosum et griseum superficiale; SGC, stratum griseum centrale; SPV, stratum periventriculare; TeO, optic tectum. Brain orientation: r, rostral; c, caudal; d, dorsal; v, ventral. Scale bars = 50 µm (A, D-G, K, and L); 20 µm (B); 200 µm (C); 100 µm (H–J). |

Retinal projections terminating in TeO.(A–D) Frontal sections of the adult TeO (lateral to the left) visualizing biocytin-labeled structures subsequent injection in the optic nerve. (A) The most anterior part of TeO shown with intensively labeled optic tract (ot). (B) More posterior TeO showing the biocytin-labeled nerve terminals in the upper layer of TeO. C and D show a higher magnification of the squared areas in (B), showing the layered cytoarchitecture of the TeO. Abbreviations: ot, optic tract; SAC, stratum album centrale; SFGS, stratum fibrosum et griseum superficiale; SGC, stratum griseum centrale; SM, stratum marginale; SO, stratum opticum; SPV, stratum periventriculare; Tel, telencephalon; TeO, optic tectum. Brain orientation: r, rostral; c, caudal; d, dorsal; v, ventral. Scale bars = 200 µm (A and B); 50 µm (C and D). |
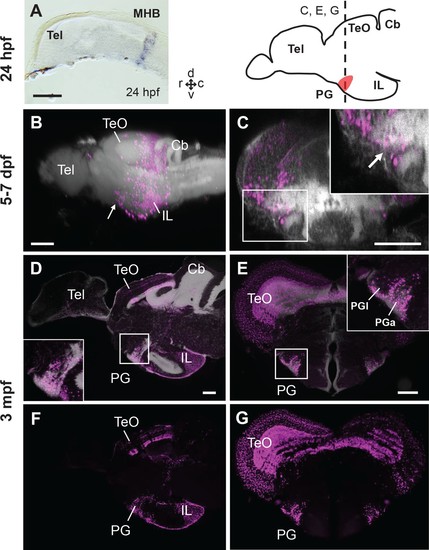
Progression of the mCherry+ cell distribution in the PG of Tg(her5:ERT2CreERT2;βactin:lox-stop-lox-hmgb1-mCherry) zebrafish treated with tamoxifen at 24hpf.(A) In situ hybridization (ISH) of ert2Cre showing that the expression of Cre in this line is limited to the midbrain-hindbrain boundary (MHB) at 24 hpf. (B–G) Sagittal (B, D, F) and frontal (C, E, G) views of brains showing the development of PG region. The schematic drawing of the zebrafish brain shows the position of PG (indicating the level of the frontal sections shown in C, E, and G). Higher magnifications of the PG region are shown in the insets. mCherry+ cells are shown in magenta, and brain morphology (DiD fiber labeling in B and C, DAPI in D and E) is shown in grey. (B and C) 3D reconstruction from confocal images of 5–7 dpf larval brains (images reused from Bloch et al., 2019). The arrows indicate the PG primordium. (D–G) Adult brain sections, with (D and E) and without DAPI (F and G). Abbreviations: Cb, cerebellum; IL, inferior lobe; MHB, midbrain-hindbrain boundary; PG, preglomerular complex; PGa, anterior preglomerular nucleus; PGl, lateral preglomerular nucleus; Tel, telencephalon; TeO, optic tectum. Brain orientation: r, rostral; c, caudal; d, dorsal; v, ventral. Scale bars = 100 µm. |
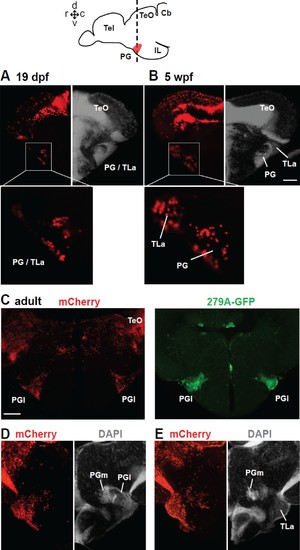
Distribution of mCherry+ cells in the PG following tamoxifen induction at 24 hpf in Tg(her5:ERT2CreERT2;βactin:lox-stop-lox-hmgb1-mCherry).A and B show frontal sections of juvenile brains, and C–E show of adult brains. The level of the frontal sections is indicated in the schematic drawing on the top. (A and B) mCherry+ cells at the level of PG at two different juvenile stages. The left half of the frontal section shows the distribution of mCherry (red), whereas the right half shows DAPI staining (grey) to illustrate the cytoarchitecture of the brain. At 19 dpf (A), the nucleus is labeled as ‘PG/TLa’, because they develop as a continuous structure and not easy to distinguish until around 5 wpf (B). (C) Adult brain sections at the level of PGl comparing the mCherry expression in Tg(her5:ERT2CreERT2;βactin:lox-stop-lox-hmgb1-mCherry) and GFP expression in Tg(279A-GFP). Abundant mCherry+ cells are found in the adult PGl, overlapping the location of GFP+ pallial projection neurons. (D and E) Adult brain sections showing more caudal levels than (C). The left half of the frontal section shows the distribution of mCherry (red), whereas the right half shows DAPI staining (grey) to illustrate the cytoarchitecture of the brain. E shows more caudal than D. The mCherry labelings are found throughout the PG, including the caudal PGl and PGm. Abbreviations: Cb, cerebellum; IL, inferior lobe; PG, preglomerular complex; PGl, lateral preglomerular nucleus; PGm, medial preglomerular nucleus; Tel, telencephalon, TeO, optic tectum; TLa, torus lateralis. Brain orientation: r, rostral; c, caudal; d, dorsal; v, ventral. Scale bars = 50 µm (B), 200 µm (C). |
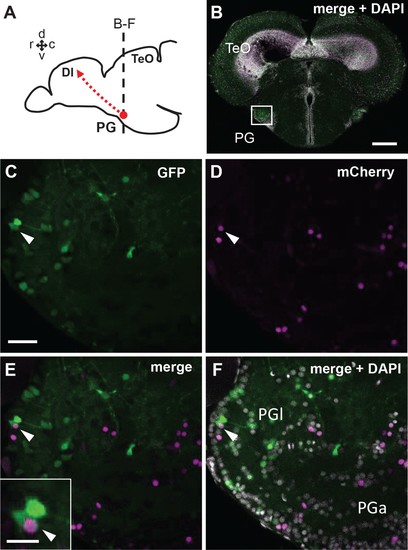
Co-localization of GFP and mCherry in the adult PG cells of the quadruple transgenic line Tg(her5:ERT2CreERT2;βactin:lox-stop-lox-hmgb1-mCherry;279A-GFP) following the tamoxifen induction at 24 hpf.(A) Schematic drawing of the adult zebrafish brain indicating the level of section through the PG shown in B-F. (B) A single plane confocal image showing a global view of the frontal section of a 3 mpf zebrafish brain. The white square indicates the PGl shown in C-F at a higher magnification. (C–F) A confocal image (5 µm projection) showing the co-localization of GFP and mCherry in PGl (arrowheads). Inset of E shows the double-labeled cell at a higher magnification. Abbreviations: Dl, lateral part of dorsal telencephalic area; PG, preglomerular complex; PGa, anterior preglomerular nucleus; PGl, lateral preglomerular nucleus; TeO, optic tectum. Brain orientation: r, rostral; c, caudal; d, dorsal; v, ventral. Scale bars = 200 µm (B); 30 µm (C; applicable to D-F); 10 µm (inset of E). |
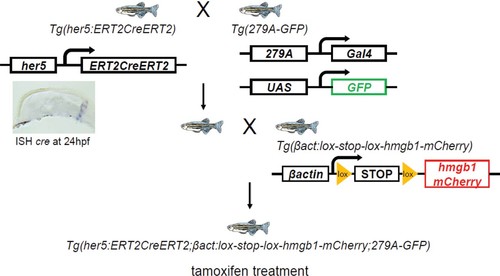
A simplified schema of the constructs of transgenic lines and order of crossing to generate the first quadruple transgenic fish: Tg(her5:ERT2CreERT2;βactin:lox-stop-lox-hmgb1-mCherry;279A-GFP). |
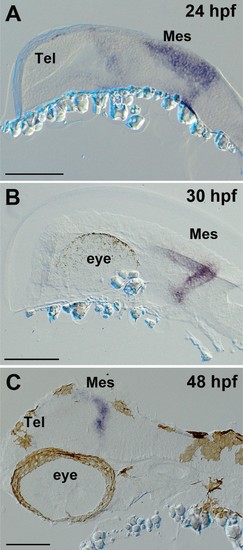
Expression of ert2Cre in the Tg(Dr830:ERT2CreERT2) embryonic brains.(A–C) Sagittal sections of embryonic brains (rostral to the left). At 24 hpf (A), ert2Cre is highly expressed in the mesencephalic domain, and a weak expression is also found in the anterior part of the brain. Later, at 30 hpf (B), the ertCre expression becomes limited to the mesencephalon. At 48 hpf (C), the ertCre expression is found exclusively in the tectal area. In C, the section plane is slightly tilted showing a more dorsal view of the embryo. Abbreviations: Mes, mesencephalic area; Tel, telencephalic area. Scale bars = 100 µm. |
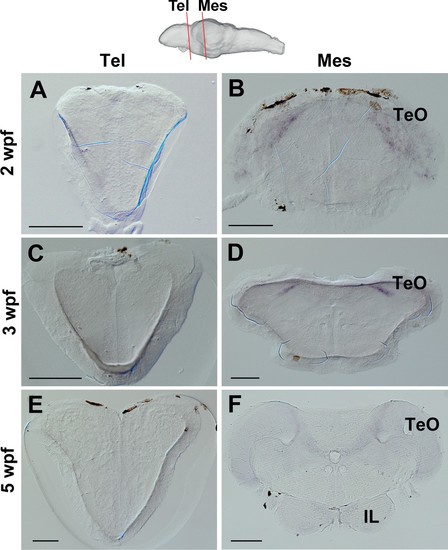
Expression of ert2Cre in the Tg(Dr830:ERT2CreERT2) juvenile brains.(A–F) Frontal sections of juvenile brains showing the telencephalic (Tel) and mesencephalic (Mes) areas. The levels of the frontal sections are indicated on the schematic drawing of a lateral view of the brain. In the 2 wpf (A and B), 3 wpf (C and D), and 5 wpf (E and F) juvenile brains, ert2Cre is expressed exclusively in the tectal area (B, D, and F). Abbreviations: IL, inferior lobe; Mes, mesencephalic area; Tel, telencephalic area; TeO, optic tectum. Scale bars = 100 µm (A–E); 200 µm (F). |
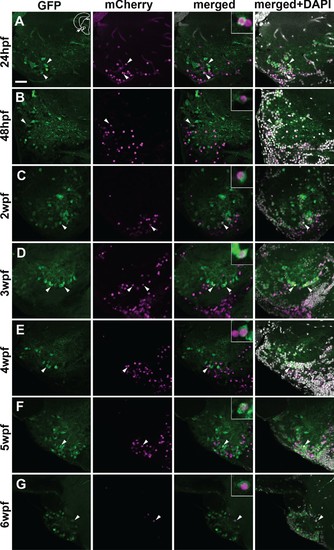
Co-localization of GFP and mCherry in the adult PG cells of the quadruple transgenic line Tg(Dr830:ERT2CreERT2;βactin:lox-stop-lox-hmgb1-mCherry;279A-GFP) following the tamoxifen induction at different developmental stages.(A–G) Confocal images (5 µm projection) of frontal sections through the PG showing the co-localization of GFP and mCherry (arrowheads). The GFP/mCherry co-localization was consistently observed in the animals induced up to 6 wpf. Co-labelled cells are shown at a higher magnification in the insets in merged images. The section plane shown here is identical to that in Figure 6. Scale bar = 30 µm. |
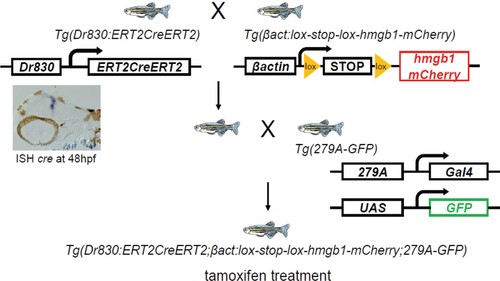
A simplified schema of the constructs of transgenic lines and order of crossing to generate the second quadruple transgenic fish: Tg(Dr830:ERT2CreERT2;βactin:lox-stop-lox-hmgb1-mCherry;279A-GFP). |