
Fig. 5
- ID
- ZDB-FIG-200928-21
- Publication
- Bloch et al., 2020 - Non-thalamic origin of zebrafish sensory nuclei implies convergent evolution of visual pathways in amniotes and teleosts
- Other Figures
- All Figure Page
- Back to All Figure Page
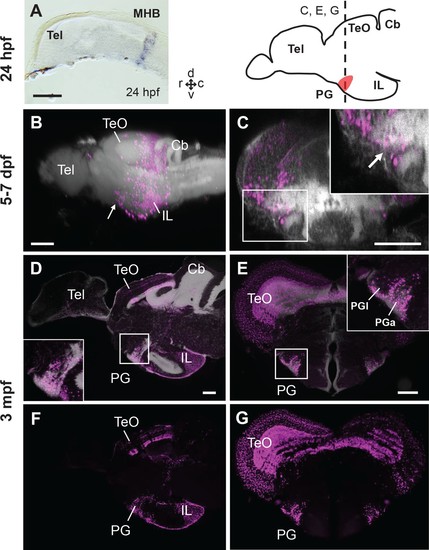
Progression of the mCherry+ cell distribution in the PG of Tg(her5:ERT2CreERT2;βactin:lox-stop-lox-hmgb1-mCherry) zebrafish treated with tamoxifen at 24hpf.(A) In situ hybridization (ISH) of ert2Cre showing that the expression of Cre in this line is limited to the midbrain-hindbrain boundary (MHB) at 24 hpf. (B–G) Sagittal (B, D, F) and frontal (C, E, G) views of brains showing the development of PG region. The schematic drawing of the zebrafish brain shows the position of PG (indicating the level of the frontal sections shown in C, E, and G). Higher magnifications of the PG region are shown in the insets. mCherry+ cells are shown in magenta, and brain morphology (DiD fiber labeling in B and C, DAPI in D and E) is shown in grey. (B and C) 3D reconstruction from confocal images of 5–7 dpf larval brains (images reused from Bloch et al., 2019). The arrows indicate the PG primordium. (D–G) Adult brain sections, with (D and E) and without DAPI (F and G). Abbreviations: Cb, cerebellum; IL, inferior lobe; MHB, midbrain-hindbrain boundary; PG, preglomerular complex; PGa, anterior preglomerular nucleus; PGl, lateral preglomerular nucleus; Tel, telencephalon; TeO, optic tectum. Brain orientation: r, rostral; c, caudal; d, dorsal; v, ventral. Scale bars = 100 µm. |