
- Title
-
Zebrafish F-box Protein fbxo3 Negatively Regulates Antiviral Response through Promoting K27-Linked Polyubiquitination of the Transcription Factors irf3 and irf7
- Authors
- Li, Z., Fan, S., Wang, J., Chen, X., Liao, Q., Liu, X., Ouyang, G., Cao, H., Xiao, W.
- Source
- Full text @ J. Immunol.

Zebrafish fbxo3 inhibits ifn activation induced by poly(I:C) stimulation and SVCV infection in EPC cells. (A–D) Overexpression of fbxo3 suppressed ISRE (A), zebrafish IFN-φ1 (B), IFN-φ3 (C), and EPC-IFN (D) reporter activity induced by poly(I:C) in EPC cells in a dose-dependent manner. EPC cells were transfected with each luciferase reporter (0.2 μg per well) together with HA empty vector or an increasing amount of the HA-fbxo3 vector (0.1 and 0.2 μg per well), respectively. After 24 h, the cells were transfected with poly(I:C) (1 μg/ml) for 24 h, and then luciferase reporter activity assays were performed. (E–H) Overexpression of fbxo3 suppressed ISRE (E), zebrafish IFN-φ1 (F), IFN-φ3 (G), and EPC-IFN (H) reporter activity in EPC cells induced by SVCV infection in a dose-dependent manner. EPC cells were transfected with each luciferase reporter (0.2 μg per well) together with HA empty vector or an increasing amount of the HA-fbxo3 vector (0.1 and 0.2 μg per well), respectively. After 24 h, the cells were infected with SVCV (∼1.0 × 10⁸ TCID50 per milliliter) for 24 h and then conducted luciferase reporter activity assays. Data are presented as means ± SEM of three biological replicates. *p < 0.05, **p < 0.01, ***p < 0.001, ****p < 0.0001. |
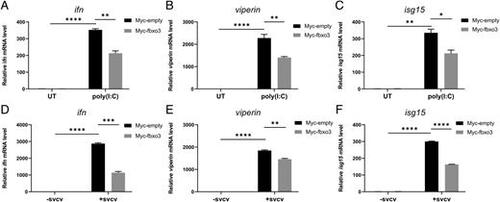
Zebrafish fbxo3 suppresses expression of IFN and ISGs induced by poly(I:C) stimulation and SVCV infection. (A–C) Overexpression of fbxo3 suppressed expression of ifn (A), viperin (B), and isg15 (C) induced by poly(I:C) (1 μg/ml) in EPC cells. (D–F) Overexpression of fbxo3 suppressed expression of ifn (D), viperin (E), and isg15 (F) induced by SVCV (∼1.00 × 10⁸ TCID50 per milliliter) infection in EPC cells. Data are presented as means ± SEM of three biological replicates. *p < 0.05, **p < 0.01, ***p < 0.001, ****p < 0.0001. |
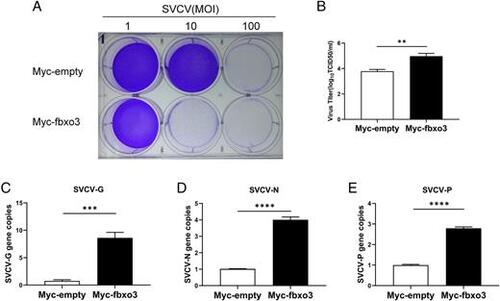
Zebrafish fbxo3 enhances virus replication in SVCV-infected EPC cells. (A) Overexpression of fbxo3 reduced cell survival of EPC cells after SVCV infection. EPC cells were transfected with 2 μg of Myc-fbxo3 or empty vector. At 24 h posttransfection, the cells were infected with SVCV at the dose indicated for 48 h. Then, the cells were fixed with 4% paraformaldehyde and stained with 1% crystal violet. (B) Overexpression of fbxo3 increased virus titers in EPC cells after SVCV infection. The culture supernatant was collected from EPC cells infected with SVCV (MOI of 100), and the viral titer was measured by plaque assay. The results are representative of three independent experiments. (C–E) Overexpression of fbxo3 increased copy number of SVCV-related genes in SVCV-infected EPC cells. EPC cells were transfected with Myc-fbxo3 or empty vector and infected with SVCV (MOI of 10). After 24 h, total RNAs were extracted for examining the mRNA levels of the G protein (C), N protein (D), and P protein (E) of SVCV by qRT-PCR analysis. Data are presented as means ± SEM of three biological replicates. **p < 0.01, ***p < 0.001, ****p < 0.0001. |
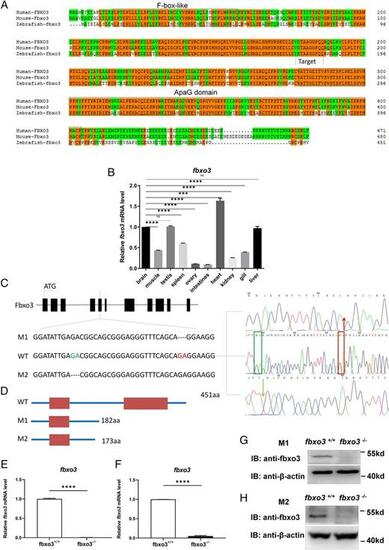
Generation of fbxo3-null zebrafish via CRISPR/Cas9 technology. (A) Amino acid sequence alignment of human, mouse, and zebrafish fbxo3. Human FBXO3 (ENSG00000110429), mouse Fbxo3 (ENSMUSG00000027180), zebrafish fbxo3 (ENSDARG00000029242); the same amino acids are highlighted with orange, the F-box–like domain and ApaG domain are circled with blue boxes. (B) Expression pattern of fbxo3 in different tissues of adult zebrafish (3 mpf) as revealed by qRT-PCR assays. (C) Scheme of the genomic structure of zebrafish fbxo3. The sequence information of fbxo3 zebrafish mutant: fbxo3ihb0703/ihb0703 (M1), 2 bp nt (GA) were deleted from exon 5 of fbxo3, resulting in a reading frame shift and generating truncated proteins with 182 aa; fbxo3ihb1224/ihb1224 (M2), 2 bp nt (GA) were deleted from exon 5 of fbxo3, resulting in a reading frame shift and generating truncated proteins with 173 aa. (D) Scheme of the putative peptides of the WT transcript and the two mutated fbxo3 transcripts. (E) Expression of fbxo3 mRNA in larvae from the WT (fbxo3+/+) and the fbxo3-null (fbxo3ihb0703/ihb0703) zebrafish (4 dpf; n = 50, respectively). (F) Expression of fbxo3 mRNA in larvae from the WT (fbxo3+/+) and the fbxo3-null (fbxo3ihb1224/ihb1224) zebrafish (4 dpf; n = 50, respectively). (G) Expression of fbxo3 protein in brain from the WT (fbxo3+/+) and the fbxo3-null (fbxo3ihb0703/ihb0703) zebrafish (2 mpf). (H) Expression of fbxo3 protein in brain from the WT (fbxo3+/+) and the fbxo3-null (fbxo3ihb1224/ihb1224) zebrafish (2 mpf). Data are presented as means ± SEM of three biological replicates. ***p < 0.001, ****p < 0.0001. ns, no significance. PHENOTYPE:
|
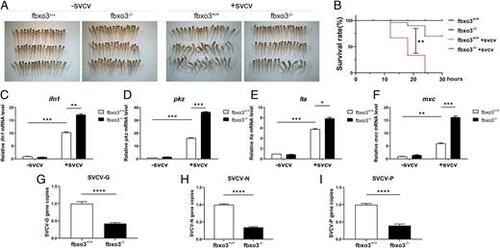
fbxo3-null zebrafish are more resistant to SVCV infection than WT zebrafish. (A) Representative images of fbxo3-null zebrafish larvae and their WT siblings (3 dpf) infected with or without SVCV for 18 h. Dead larvae exhibited lack of movement, absence of blood circulation and body degeneration. SVCV viruses (∼1 × 10⁸ TCID50 per milliliter) was added into the water containing fbxo3-null larvae or the WT, and then the number of dead larvae was counted at different time points. (B) fbxo3-null zebrafish (n = 50 for each experiment) were more resistant to SVCV infection compared with the WT (n = 50 for each experiment) based on the survival ratio. (C–F) After challenge with SVCV for 12 h, induction of key antiviral genes including ifn1 (C), pkz (D), lta (E), and mxc (F) was more significant in fbxo3-null larvae compared with the WT larvae. (G–I) After challenge with SVCV for 24 h, the virus replication number indicated by the expression of the G (G), N (H), and P (I) genes of SVCV, was lower in the fbxo3-null ZFL compared with the WT ZFL infected with SVCV. Data are presented as means ± SEM of three biological replicates. *p < 0.05, **p < 0.01, ***p < 0.001, ****p < 0.0001. EXPRESSION / LABELING:
PHENOTYPE:
|
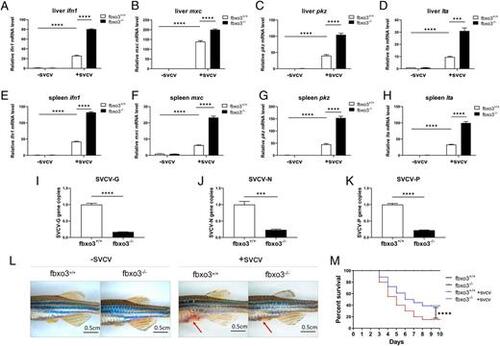
fbox3-null zebrafish display higher resistance to SVCV infection in liver and spleen. (A–D) Induction of key antiviral genes was more significant in fbxo3-null ZFL compared with the WT ZFL infected with SVCV. (E–H) Induction of key antiviral genes was more significant in fbxo3-null zebrafish spleen compared with the WT zebrafish spleen infected with SVCV. (I–K) The virus replication number indicated by the expression of the G (I), N (J), and P (K) genes of SVCV, was lower in the fbxo3-null ZFL compared with the WT ZFL infected with SVCV. (L) Representative images of fbxo3-null zebrafish (2 mpf) and their WT siblings (2 mpf) i.p. injected with or without SVCV at 10 μl per individual for 48 h. Red arrow indicates hemorrhage. (M) fbxo3-null zebrafish (2 mpf) (n = 20) were more resistant to SVCV infection compared with the WT (2 mpf) (n = 20) based on the survival ratio. Data are presented as means ± SEM of three biological replicates. ***p < 0.001, ****p < 0.0001. EXPRESSION / LABELING:
PHENOTYPE:
|
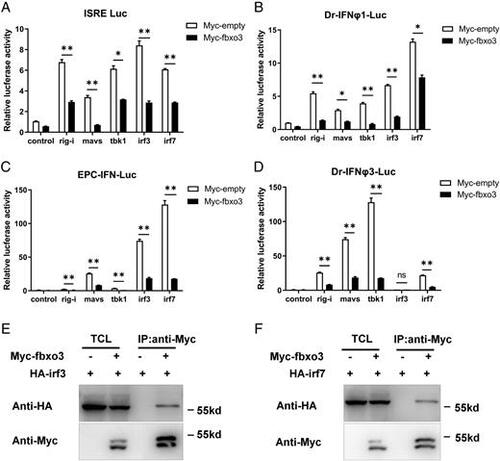
Zebrafish fbxo3 inhibits RLR-mediated IFN induction and interacts with both irf3 and irf7. (A–D) Overexpression of fbxo3 suppressed rig-i–, mavs-, tbk1-, irf3-, and irf7-induced activation of ISRE (A), zebrafish IFN-φ1 promoter luciferase (B), EPC-IFN promoter luciferase (C) and zebrafish IFNφ3 promoter luciferase (D) reporter activity in EPC cells. (E and F) fbxo3 interacts with irf3 (E) and irf7 (F). HEK 293T cells seeded in 100-mm dishes were transfected with the indicated plasmids (5 μg each). After 24 h, total cell lysates were immunoprecipitated (IP) with anti-Myc agarose beads. Then the immunoprecipitates and cell lysates were detected with anti-Myc or anti-HA Ab, respectively. Data are presented as means ± SEM of three biological replicates. *p < 0.05, **p < 0.01. ns, no significance. |

Fbxo3 promotes proteasomal degradation of irf3 and irf7. (A) Immunoblot of lysates from HEK293T cells transiently expressing Myc-empty, Myc-fbxo3, and HA-irf3 for 24 h and then cultured in the presence of the proteasome inhibitor, MG132 (20 mM) or DMSO for 8 h. (B) Immunoblot of lysates from HEK293T cells transiently expressing Myc-empty, Myc-fbxo3, and HA-irf7 for 24 h and then cultured in the presence of the proteasome inhibitor MG132 (20 mM) or DMSO for 8 h. (C) HEK293T cells were transfected with Myc-empty, Myc-fbxo3, and HA-irf3. After 24 h, CHX (100 ng/ml) was added to inhibit new protein synthesis, and the cells were harvested at different timepoints. Quantitation of the protein levels is shown on the right panel. (D) HEK293T cells were transfected with Myc-empty, Myc-fbxo3, and HA-irf7. After 24 h, CHX (100 ng/ml) was added to inhibit new protein synthesis, and the cells were harvested at different timepoints. Quantitation of the protein levels is shown on the right panel. (E) The protein level of irf3 and p-irf3 was higher in fbxo3-null ZFL compared with that in WT zebrafish. (F) The protein level of irf7 was higher in fbxo3-null ZFL compared with that in WT zebrafish. fbxo3-null zebrafish (2 mpf) and their WT siblings (2 mpf) were i.p. injected with (+) or without (−) SVCV at 10 μl/individual for 48 h, then their livers were dissected for Western blot analysis using anti-irf3, anti–p-irf3, or anti-irf7 Abs. *p < 0.05, **p < 0.01, ***p < 0.001, ****p < 0.0001. IB, immunoblot, ns, no significance. EXPRESSION / LABELING:
PHENOTYPE:
|

Overexpression of fbxo3 inhibits K27-linked polyubiquitination of irf3 and irf7. (A) fbxo3 promoted the polyubiquitination of irf7 but not lysine 48 (K48)–linked polyubiquitination and lysine 63 (K63)–linked polyubiquitination. (B) fbxo3 promoted lysine 27 (K27)–linked polyubiquitination of irf7 but did not promote K6-, K11-, K29- and K33-linked polyubiquitination. (C) fbxo3 promoted K27-linked polyubiquitination of irf7. (D) fbxo3 promoted the polyubiquitination of irf3 but not K48-linked polyubiquitination and K63-linked polyubiquitination. (E) fbxo3 promoted the K27 polyubiquitination of irf3 but did not promote the K6-, K11-, K29-, and K33- inked polyubiquitination of irf3. (F) fbxo3 promoted K27-linked polyubiquitination of irf3. HEK 293T cells were transfected with HA-irf3 (6 μg) or HA-irf7 (6 μg), Myc-fbxo3 (4 μg), or empty vector (4 μg), together with His-ubiquitin or its mutants (4 μg). At 18 h posttransfection, the cells were treated with MG132 for 6 h. At 24 h posttransfection, the cells were lysed using guanidinium chloride, and purified with Ni2+-NTA agarose. IB, immunoblot; KO, K-only; KR, K is mutated to R. |