
|
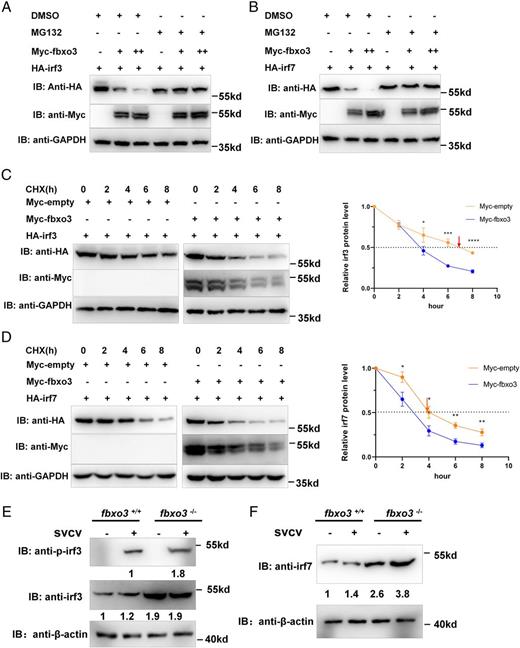
Fig. 8 Fbxo3 promotes proteasomal degradation of irf3 and irf7. (A) Immunoblot of lysates from HEK293T cells transiently expressing Myc-empty, Myc-fbxo3, and HA-irf3 for 24 h and then cultured in the presence of the proteasome inhibitor, MG132 (20 mM) or DMSO for 8 h. (B) Immunoblot of lysates from HEK293T cells transiently expressing Myc-empty, Myc-fbxo3, and HA-irf7 for 24 h and then cultured in the presence of the proteasome inhibitor MG132 (20 mM) or DMSO for 8 h. (C) HEK293T cells were transfected with Myc-empty, Myc-fbxo3, and HA-irf3. After 24 h, CHX (100 ng/ml) was added to inhibit new protein synthesis, and the cells were harvested at different timepoints. Quantitation of the protein levels is shown on the right panel. (D) HEK293T cells were transfected with Myc-empty, Myc-fbxo3, and HA-irf7. After 24 h, CHX (100 ng/ml) was added to inhibit new protein synthesis, and the cells were harvested at different timepoints. Quantitation of the protein levels is shown on the right panel. (E) The protein level of irf3 and p-irf3 was higher in fbxo3-null ZFL compared with that in WT zebrafish. (F) The protein level of irf7 was higher in fbxo3-null ZFL compared with that in WT zebrafish. fbxo3-null zebrafish (2 mpf) and their WT siblings (2 mpf) were i.p. injected with (+) or without (−) SVCV at 10 μl/individual for 48 h, then their livers were dissected for Western blot analysis using anti-irf3, anti–p-irf3, or anti-irf7 Abs. *p < 0.05, **p < 0.01, ***p < 0.001, ****p < 0.0001. IB, immunoblot, ns, no significance.