FIGURE SUMMARY
Title

Immunohistochemical Analysis of Intestinal and Central Nervous System Morphology in an Obese Animal Model (Danio rerio) Treated with 3,5-T2: A Possible Farm Management Practice?

Authors
Imperatore, R., Tunisi, L., Mavaro, I., D'Angelo, L., Attanasio, C., Safari, O., Motlagh, H.A., De Girolamo, P., Cristino, L., Varricchio, E., Paolucci, M.
Source
Full text @ Animals (Basel)

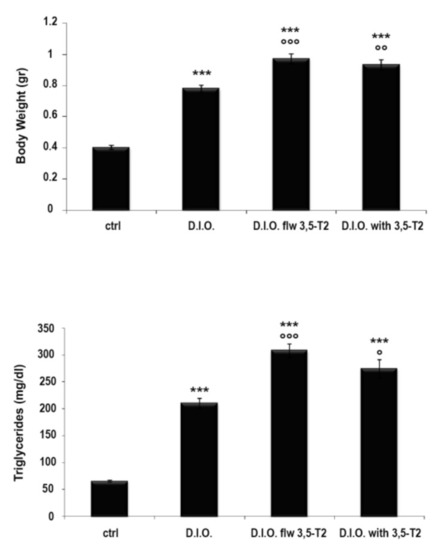
3,5-T2 effect on the body weight and triglyceride levels. ctrl (control zebrafish), D.I.O. (diet-induced obesity zebrafish), D.I.O. flw 3,5–T2 (D.I.O. zebrafish followed by 3,5–T2), D.I.O. with 3,5–T2 (D.I.O. zebrafish treated with 3,5–T2). Data are expressed as mean ± SE. *** p < 0.0001 compared to the control group; °°° p < 0.0001, °° p < 0.0001, and ° p < 0.05 compared to D.I.O.

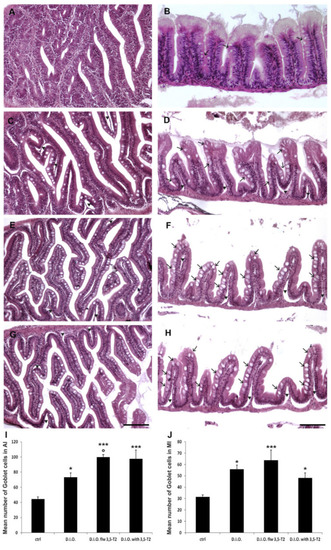
Hematoxylin and eosin (H&E) staining of anterior (AI) and mid (MI) intestine of ctrl (control zebrafish), D.I.O. (diet-induced obesity zebrafish), D.I.O. flw 3,5–T2 (D.I.O. zebrafish followed by 3,5–T2), D.I.O. with 3,5–T2 (D.I.O. zebrafish treated with 3,5–T2). (A) AI and (B) MI of control zebrafish. (C) AI and (D) MI of D.I.O. (E) AI and (F) MI of D.I.O. flw 3,5–T2. (G) AI and (H) MI of D.I.O. with 3,5–T2. Arrows indicate goblet cells, arrowheads indicate ragged villi. (I,J) Bar graphs showing the number of goblet cells in the (I) AI and (J) MI of ctrl, D.I.O., D.I.O. flw 3,5–T2 and D.I.O. with 3,5–T2. Goblet cells were counted based on Alcian Blue staining. Data are expressed as mean ± SE. *** p < 0.0001, * p < 0.05 compared to the control group. ° p < 0.05 compared to D.I.O. Scale bar: 100 μm.

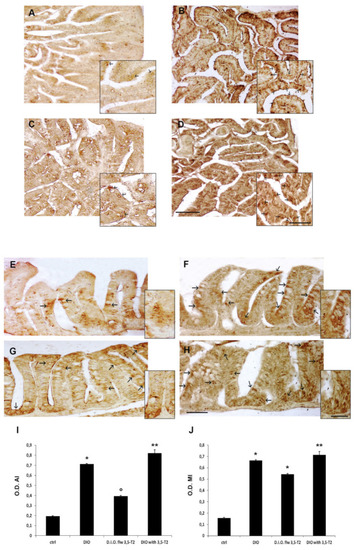
TNFα immunostaining in the anterior (AI) and mid (MI) intestine of ctrl (control zebrafish), D.I.O. (diet-induced obesity zebrafish), D.I.O. flw 3,5–T2 (D.I.O. zebrafish followed by 3,5–T2), D.I.O. with 3,5–T2 (D.I.O. zebrafish treated with 3,5–T2). (A) AI of ctrl zebrafish (B) AI of D.I.O. (C) AI of D.I.O. flw 3,5–T2. (D) AI of D.I.O. with 3,5–T2. (E) MI of ctrl zebrafish. (F) MI of D.I.O. (G) MI of D.I.O. flw 3,5–T2. and (H) MI of D.I.O. with 3,5–T2. The arrows indicate TNFα immunoexpression in the enteroendocrine and goblet cells. (I,J) Bar graphs showing TNFα optical density (O.D.) in the (I) AI and (J) MI of ctrl, D.I.O., D.I.O. flw 3,5–T2 and D.I.O. with 3,5–T2. Data are expressed as mean ± SE. ** p < 0.001, * p < 0.05 compared to the control group. ° p < 0.05 compared to D.I.O. Scale bar: 100 μm in the low magnification and 50 μm in the higher magnification in the boxes of A–D. 50 μm in the low magnification and 25 μm in the higher magnification in the boxes of E–H.

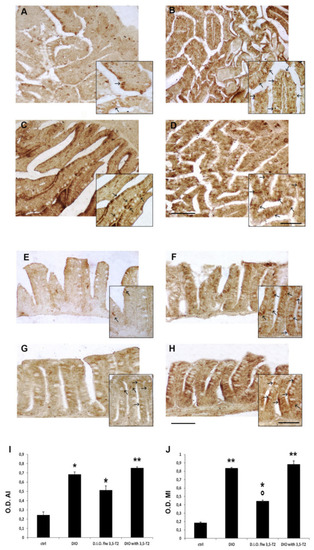
COX2 immunostaining in the anterior (AI) and mid (MI) intestine of ctrl (control zebrafish), D.I.O. (diet-induced obesity zebrafish), D.I.O. flw 3,5–T2 (D.I.O. zebrafish followed by 3,5–T2), D.I.O. with 3,5–T2 (D.I.O. zebrafish treated with 3,5–T2). (A) AI of ctrl zebrafish (B) AI of D.I.O. (C) AI of D.I.O. flw 3,5–T2. (D) AI of D.I.O. with 3,5–T2. (E) MI of ctrl zebrafish. (F) MI of D.I.O. (G) MI of D.I.O. flw 3,5–T2. and (H) MI of D.I.O. with 3,5–T2. The arrows indicate COX2 immunoexpression in the enteroendocrine and goblet cells. (I,J) Bar graphs showing COX2 optical density (O.D.) in the (I) AI and (J) MI of ctrl, D.I.O., D.I.O. flw 3,5–T2 and D.I.O. with 3,5–T2. Data are expressed as mean ± SE. ** p < 0.001, * p < 0.05 compared to the control group. ° p < 0.05 compared to D.I.O. Scale bar: 100 μm in the low magnification and 50 μm in the higher magnification in the boxes.

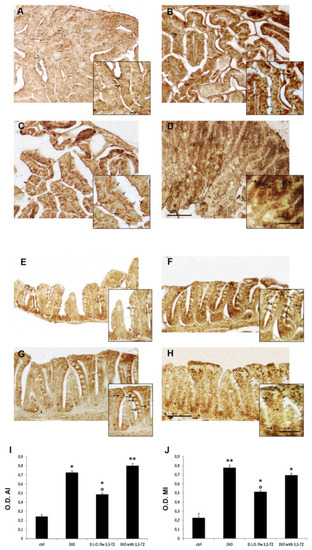
Calnexin immunostaining in the anterior (AI) and mid (MI) intestine of ctrl (control zebrafish), D.I.O. (diet-induced obesity zebrafish), D.I.O. flw 3,5–T2 (D.I.O. zebrafish followed by 3,5–T2), D.I.O. with 3,5–T2 (D.I.O. zebrafish treated with 3,5–T2). (A) AI of ctrl zebrafish (B) AI of D.I.O. (C) AI of D.I.O. flw 3,5–T2. (D) AI of D.I.O. with 3,5–T2. (E) MI of ctrl zebrafish. (F) MI of D.I.O. (G) MI of D.I.O. flw 3,5–T2. and (H) MI of D.I.O. with 3,5–T2. The arrows indicate calnexin immunoexpression in the enteroendocrine and goblet cells. (I,J) Bar graphs showing calnexin optical density (O.D.) in the (I) AI and (J) MI of ctrl, D.I.O., D.I.O. flw 3,5–T2 and D.I.O. with 3,5–T2. Data are expressed as mean ± SE. ** p < 0.001, * p < 0.05 compared to the control group. ° p < 0.05 compared to D.I.O. Scale bar: 100 μm in the low magnification and 50 μm in the higher magnification in the boxes.

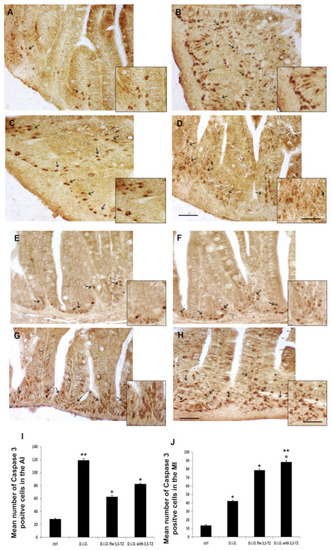
Caspase 3 immunostaining in the anterior (AI) and mid (MI) intestine of ctrl (control zebrafish), D.I.O. (diet-induced obesity zebrafish), D.I.O. flw 3,5–T2 (D.I.O. zebrafish followed by 3,5–T2), D.I.O. with 3,5–T2 (D.I.O. zebrafish treated with 3,5–T2). (A) AI of ctrl zebrafish (B) AI of D.I.O. (C) AI of D.I.O. flw 3,5–T2. (D) AI of D.I.O. with 3,5–T2. (E) MI of ctrl zebrafish. (F) MI of D.I.O. (G) MI of D.I.O. flw 3,5–T2. and (H) MI of D.I.O. with 3,5–T2. The arrows indicate caspase 3 positive cells in the folds. (I,J) Bar graphs showing the mean number of caspase 3 positive cells in the (I) AI and (J) MI of ctrl, D.I.O. flw 3,5–T2, D.I.O. and D.I.O. with 3,5–T2. Data are expressed as mean ± SE. ** p < 0.001, * p < 0.05 compared to the control group. ° p < 0.05 compared to D.I.O. Scale bar: 50 μm in the low magnification and 25 μm in the higher magnification in the boxes.

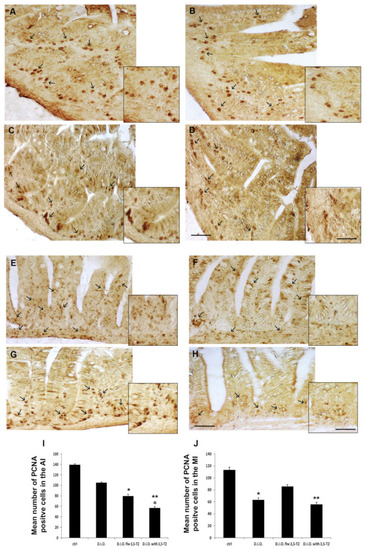
PCNA immunostaining in the anterior (AI) and mid (MI) intestine of ctrl (control zebrafish), D.I.O. (diet-induced obesity zebrafish), D.I.O. flw 3,5–T2 (D.I.O. zebrafish followed by 3,5–T2), D.I.O. with 3,5–T2 (D.I.O. zebrafish treated with 3,5–T2). (A) AI of ctrl zebrafish (B) AI of D.I.O. (C) AI of D.I.O. flw 3,5–T2. (D) AI of D.I.O. with 3,5–T2. (E) MI of ctrl zebrafish. (F) MI of D.I.O. (G) MI of D.I.O. flw 3,5–T2. and (H) MI of D.I.O. with 3,5–T2. The arrows indicate PCNA positive cells in the folds. (I,J) Bar graphs showing PCNA optical density in the (I) AI and (J) MI of ctrl, D.I.O., D.I.O. flw 3,5–T2 and D.I.O. with 3,5–T2. Data are expressed as mean ± SE. ** p < 0.001, * p < 0.05 compared to the control group. ° p < 0.05 compared to D.I.O. Scale bar: 50 μm in the low magnification and 25 μm in the higher magnification in the boxes.

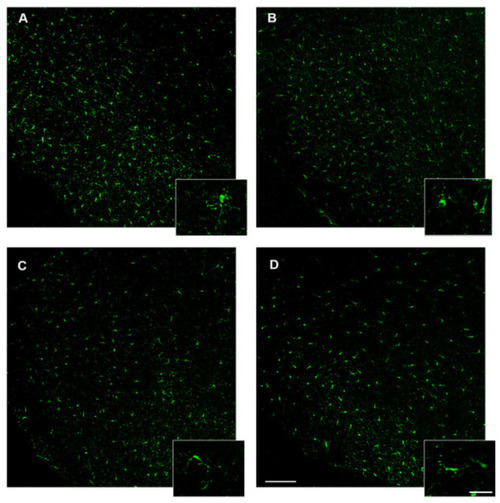
Iba1 immunostaining in the brain of zebrafish. (A) Representative image of the hypothalamus of control zebrafish showing resting microglia depicted in the box with high magnification. (B) Representative image of D.I.O. (diet-induced obesity zebrafish) hypothalamus showing activated or dystrophic microglia depicted in the box with high magnification. (C) Representative image of the hypothalamus of D.I.O. followed by 3,5-T2 showing activated or dystrophic microglia depicted in the box with high magnification. (D) Representative image of the hypothalamus of D.I.O. treated with 3,5-T2 showing activated or dystrophic microglia depicted in the box with high magnification. Scale bar: 100 μm in the low magnification and 25 μm in the higher magnification in the boxes.

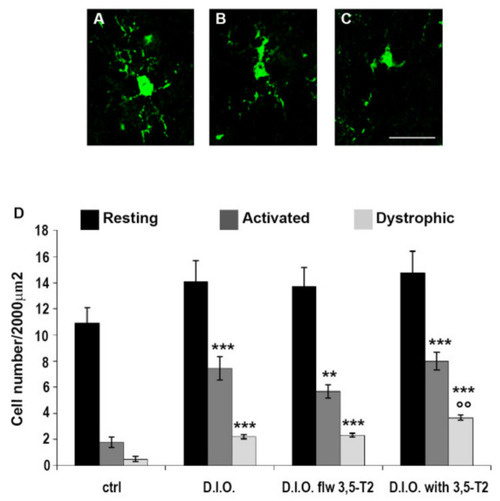
Morphological analysis of microglia in the brain of zebrafish. (AC) Representative images of different microglial morphology. (A) resting microglia, (B) activated microglia, and (C) dystrophic microglia. Scale bar: 25 μm. (D) Quantitative analysis of the resting, activated, and dystrophic-like cells in the hypothalamus of ctrl (control zebrafish), D.I.O. (diet-induced obesity zebrafish), D.I.O. flw 3,5–T2 (D.I.O. zebrafish followed by 3,5–T2), D.I.O. with 3,5–T2 (D.I.O. zebrafish treated with 3,5–T2). Data are expressed as mean ± SE. *** p < 0.0001, ** p < 0.001 compared to the control group. °° p < 0.05 compared to D.I.O.

Acknowledgments
This image is the copyrighted work of the attributed author or publisher, and ZFIN has permission only to display this image to its users. Additional permissions should be obtained from the applicable author or publisher of the image. Full text @ Animals (Basel)