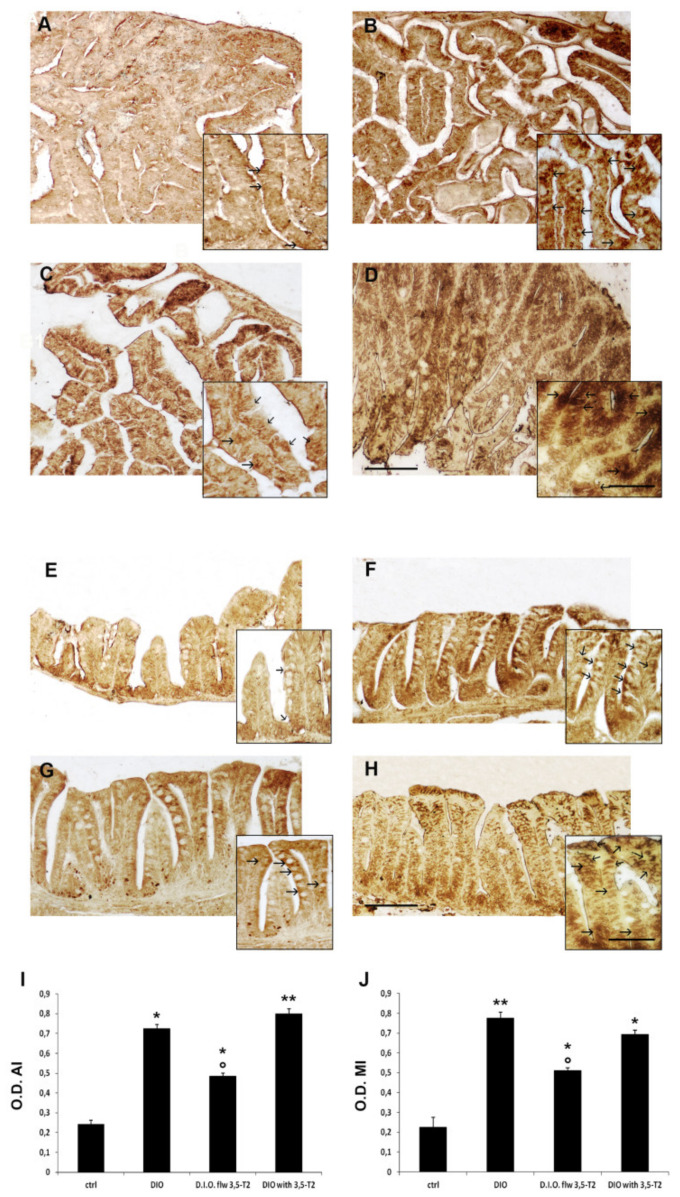
IMAGE

Figure 5

ID
ZDB-IMAGE-200811-46
Source
Figures for Imperatore et al., 2020
Image
Figure Caption

Figure 5

Calnexin immunostaining in the anterior (AI) and mid (MI) intestine of ctrl (control zebrafish), D.I.O. (diet-induced obesity zebrafish), D.I.O. flw 3,5–T2 (D.I.O. zebrafish followed by 3,5–T2), D.I.O. with 3,5–T2 (D.I.O. zebrafish treated with 3,5–T2). (A) AI of ctrl zebrafish (B) AI of D.I.O. (C) AI of D.I.O. flw 3,5–T2. (D) AI of D.I.O. with 3,5–T2. (E) MI of ctrl zebrafish. (F) MI of D.I.O. (G) MI of D.I.O. flw 3,5–T2. and (H) MI of D.I.O. with 3,5–T2. The arrows indicate calnexin immunoexpression in the enteroendocrine and goblet cells. (I,J) Bar graphs showing calnexin optical density (O.D.) in the (I) AI and (J) MI of ctrl, D.I.O., D.I.O. flw 3,5–T2 and D.I.O. with 3,5–T2. Data are expressed as mean ± SE. ** p < 0.001, * p < 0.05 compared to the control group. ° p < 0.05 compared to D.I.O. Scale bar: 100 μm in the low magnification and 50 μm in the higher magnification in the boxes.

Acknowledgments
This image is the copyrighted work of the attributed author or publisher, and ZFIN has permission only to display this image to its users. Additional permissions should be obtained from the applicable author or publisher of the image. Full text @ Animals (Basel)