
Image
|
Figure Caption
Figure 1
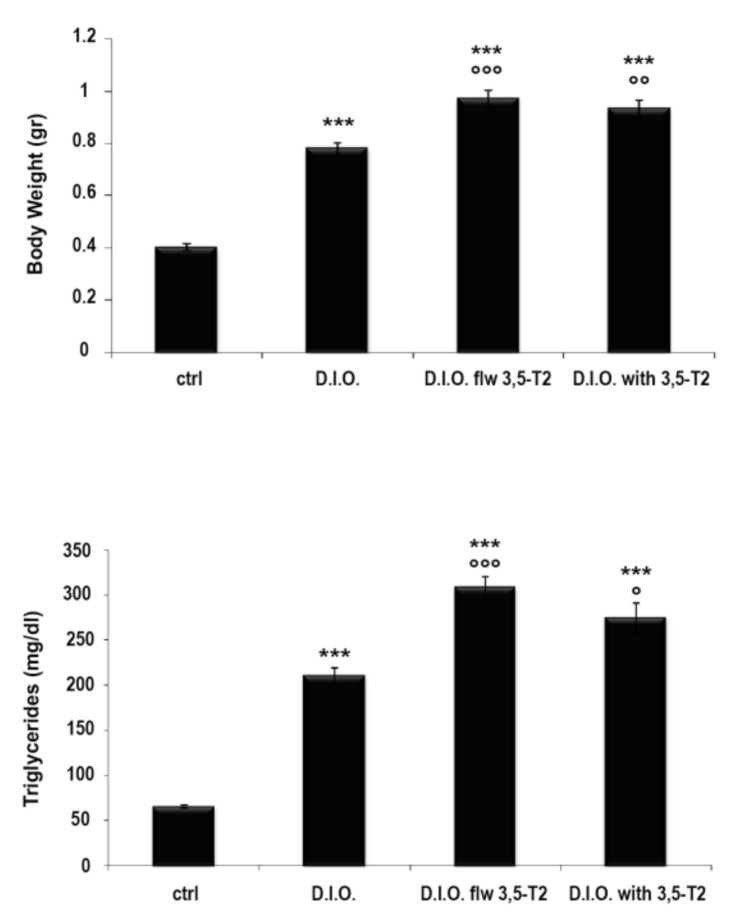
3,5-T2 effect on the body weight and triglyceride levels. ctrl (control zebrafish), D.I.O. (diet-induced obesity zebrafish), D.I.O. flw 3,5–T2 (D.I.O. zebrafish followed by 3,5–T2), D.I.O. with 3,5–T2 (D.I.O. zebrafish treated with 3,5–T2). Data are expressed as mean ± SE. ***
Acknowledgments
This image is the copyrighted work of the attributed author or publisher, and
ZFIN has permission only to display this image to its users.
Additional permissions should be obtained from the applicable author or publisher of the image.
Full text @ Animals (Basel)