
- Title
-
Tgfb3 collaborates with PP2A and Notch signaling pathways to inhibit retina regeneration
- Authors
- Lee, M., Wan, J., Goldman, D.
- Source
- Full text @ Elife
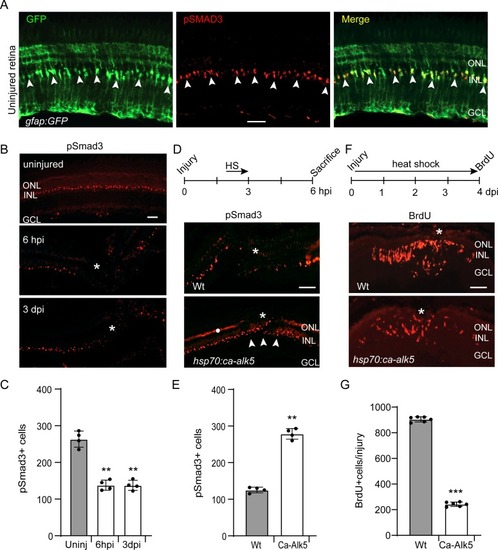
pSmad3 expression in the uninjured and injured retina.(A) Retinal section from uninjured gfap:GFP fish retina with GFP (green) and pSmad3 (red) immunofluorescence. Arrowheads point to pSmad3 expressing MG. (B) pSmad3 immunofluorescence in uninjured and needle poke injured retina. Asterisk marks injury site. (C) Quantification of data shown in (B). (D) Top diagram shows time line for heat shock treatment after injury and when fish were sacrificed. Bottom panels show pSmad3 immunofluorescence in injured and heat shock-treated Wt and hsp70:ca-Alk5 transgenic fish. Asterisk marks the injury site and arrowheads point to recovery of pSmad3 expression at the injury site in heat shock-treated hsp70:ca-alk5 transgenic fish. White dot in lower panel marks non-specific autofluorescence in the photoreceptor layer. (E) Quantification of data shown in (D). (F) Top diagram is time line for experiment illustrating injury, heat shock treatment and BrdU labelling prior to sacrifice. Lower panels show BrdU immunofluorescence in Wt and hsp70:ca-alk5 fish. Asterisk marks the injury site. (G) Quantification of data presented in (F). Error bars are SD. **p<0.01, ***p<0.001. Scale bar is 50 microns. |
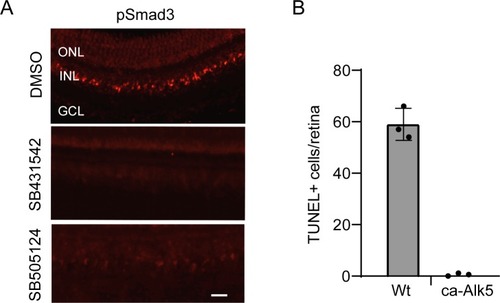
Alk5-dependent pSmad3 expression.(A) Inhibition of Tgfb receptor kinase activity suppresses pSmad3 expression. Two different Alk5 kinase inhibitors were tested. pSmad3 immunofluorescence is shown on retinal sections from uninjured fish retina. (B) Quantification of TUNEL+ cells at the site of retinal injury in heat shock-treated Wt and hsp70:ca-Alk5 fish. Scale bar is 50 microns. Error bars are SD. |
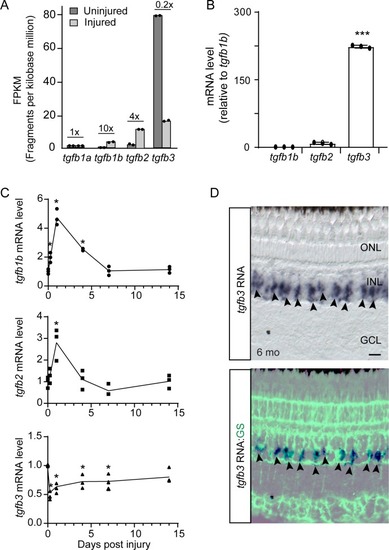
Injury-dependent regulation of tgfb gene expression.(A) RNAseq was used to quantify tgfb gene expression in FACS purified GFP+ MG isolated from uninjured and injured (2 dpi) gfap:GFP and 1016 tuba1a:GFP fish retinas, respectively. Fold change in gene expression following retinal injury is indicated above the bars. (B) qPCR quantification of tgfb gene expression in GFP+ MG FACS purified from uninjured gfap:GFP fish retina (normalized to tgfb1b). (C) qPCR quantification of tgfb gene expression following retinal injury normalized to uninjured levels. Total retinal RNA was used for qPCR. Error bars are SD. *p<0.05. (D) tgfb3 in situ hybridization and GS (glutamine synthetase) immunofluorescence in adult fish retina shows tgfb3 RNA is expressed in MG. Top panel is tgfb3 in situ hybridization; bottom panel is overlay of in situ hybridization and GS immunofluorescence. Arrowheads point to tgfb3-expressing MG. Scale bar is 50 microns. *p<0.05, ***p<0.001. |
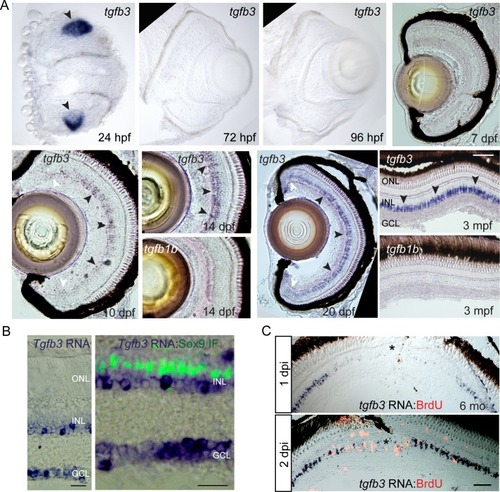
tgfb3 expression in developing and adult retina.(A) tgfb3 in situ hybridization identifies tgfb3 expression in lens at 24 hpf (hours post fertilization) and in MG beginning ~10 dpf (days post fertilization). This latter expression continues to increase throughout the first 3 months of development. Note tgfb1b expression remains undetectable by in situ hybridization at all the time points examined (14 dpf and 3 mpf). Size marker is 20 microns. In the 10 and 20 dpf panels, black arrowheads point to tgfb3expressing MG in the central retina, while white arrowheads point to reduced tgfb3 expression in the retinal periphery. (B) In situ hybridization (blue/purple product) and Sox9 immunofluorescence (green fluorescence) identifies tgfb3 expression in GCL and INL, but not in MG of the mouse retina. Size marker is 25 microns. (C) Retinal injury suppresses tgfb3expression at the injury site in 3 month old fish. In situ hybridization detects tgfb3 RNA (blue/purple product) and BrdU immunofluorescence (red/orange fluorescence) identifies proliferating cells. Size marker is 40 microns. |
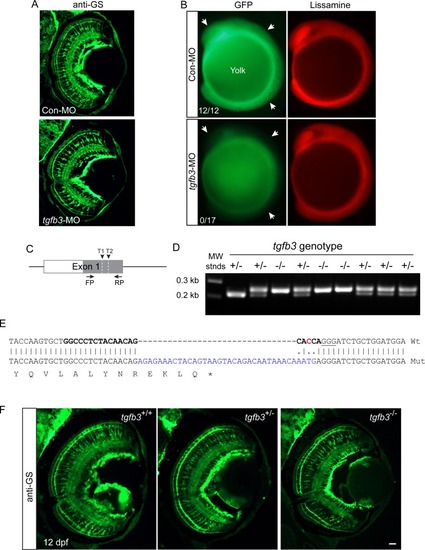
Tgfb3 knockdown and tgfb3 gene editing do not affect MG differentiation.(A) Effect of Tgfb3 knockdown on expression of MG differentiation at 6 dpf. Single cell zebrafish embryos were injected with the indicated MOs and assayed 6 days later for glutamine sythetase (GS) expression using immunofluorescence. (B) Representative images showing the consequences of experimental or control lissamine-tagged MO on reporter Tgfb3-EGFP expression at the 10 somite stage. Single cell embryos were injected with control or experimental MO along with tgfb3-EGFP RNA. At the 10 somite stage embryos were assayed for Tgfb3-EGFP expression using fluorescence microscopy. Arrows point to Tgfb3-EGFP expression in developing embryos that received control MO and to the reduced Tgfb3-EGFP expression in embryos that received experimental tgfb3-targeting MO. Numbers in panels indicate the number of lissamine+ embryos that also exhibited strong GFP expression. (C) Diagram of tgfb3exon one with position of gRNA1 and gRNA2 target sequences (T1 and T2) and primers used for PCR amplification across the mutation site. (D) Genotyping of interbred tgfb3+/- fish at 5 dpf. (E) DNA sequencing identifies an insertion/frame-shift mutation in tgfb3-/- fish at the gRNA2 target site. Shown is Wt and tgfb3 mutant (Mut) exon one sequence spanning gRNA2 target sequence (bold); predicted Cas9 cleavage site is indicated by a red C residue; pam sequence is underlined; blue sequence is insertion mutation; and asterisk indicates stop codon. (F) GS immunofluorescence in tgfb3+/+, tgfb3+/- and tgfb3-/- fish at 12 dpf shows normal MG differentiation in tgfb3+/- and tgfb3-/- fish. Shown is representative images of retinal sections with GS immunofluorescence. Size marker is 50 microns. |
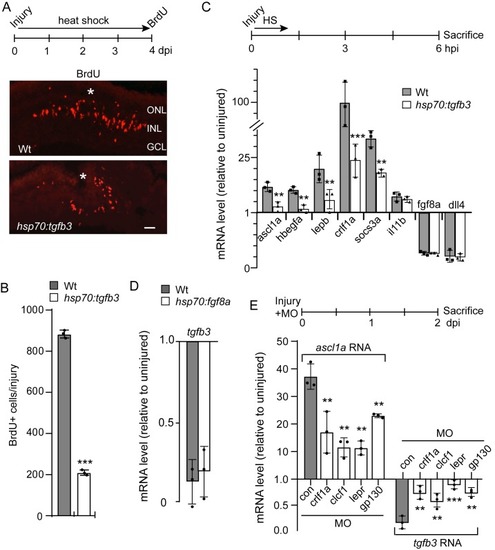
Tgfb3 suppresses MG proliferation and reprogramming gene expression.(A) Top illustration is experimental time line. Bottom panels are BrdU immunofluorescence in injured and heat shock-treated Wt and hsp70:tgfb3 transgenic fish. Asterisk marks injury site. Scale bar is 50 microns. (B) Quantification of data in (A). (C) Top illustration is experimental time line. Fish received a needle poke injury and a 1 hr heat shock and then sacrificed at 6 hpi for RNA analysis by qPCR. Bottom graph is qPCR quantification of select reprogramming gene expression levels in the indicated fish lines at 6 hpi. (D) Experimental time line is as in (C) and tgfb3 levels were assayed in the indicated fish lines at 6 hpi. (E) Top illustration is experimental time line. Bottom panel is qPCR analysis of ascl1a and tgfb3 gene expression with and without the indicated MO treatment. MO, is morpholino-modified antisense oligonucleotide used to knockdown expression from the indicated gene. Error bars are SD. *p<0.05, **p<0.01, ***p<0.001. |
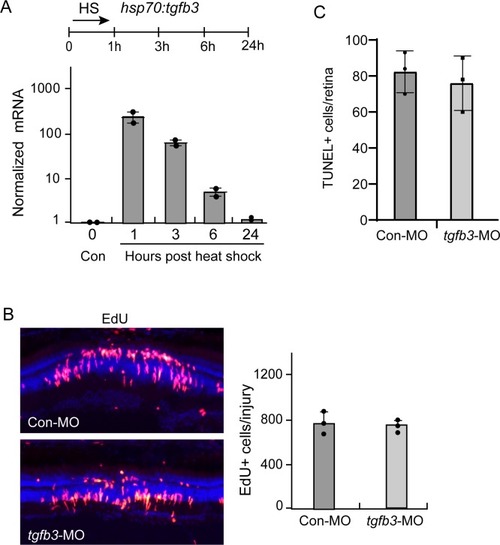
tgfb3 gene expression in hsp70:tgfb3 fish.(A) Heat shock induction of tgfb3 RNA in hsp70:tgfb3 transgenic fish. Top illustration is experimental time line. Bottom graph is qPCR quantification of tgfb3 gene expression. (B) Tgfb3 knockdown has no effect on MG proliferation in the injured retina. Control or antisense tgfb3-targeting MOs were electroporated into the retina at the time of injury and MG proliferation assayed at 4 dpi, 3 hr after receiving an IP injection of EdU. Left-hand panel is representative image of the injury site with EdU+ cells. Right-hand panel is quantification of EdU+ cells in the INL of the injured retina. (C) Quantification of TUNEL+ cells. |
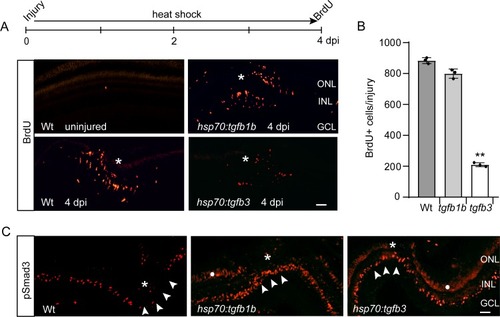
Tgfb1b and Tgfb3 stimulate pSmad3 expression, but only Tgfb3 inhibits injury-dependent MG proliferation.(A) Top illustration is experimental time line. Bottom panels show BrdU immunofluorescence on retinal sections from uninjured and injured, heat shock-treated Wt, hsp70:tgfb1b, and hsp70:tgfb3 transgenic fish. (B) Quantification of data in (A). (C) pSmad3 immunofluorescence on retinal sections from uninjured and injured, heat shock-treated Wt, hsp70:tgfb1b, and hsp70:tgfb3 transgenic fish. Arrowheads point to the INL at the injury site. Asterisk marks the injury site. White dot in two right-hand panels marks non-specific autofluorescence in the photoreceptor layer. Scale bar is 50 microns. Error bars are SD. **p<0.01. |
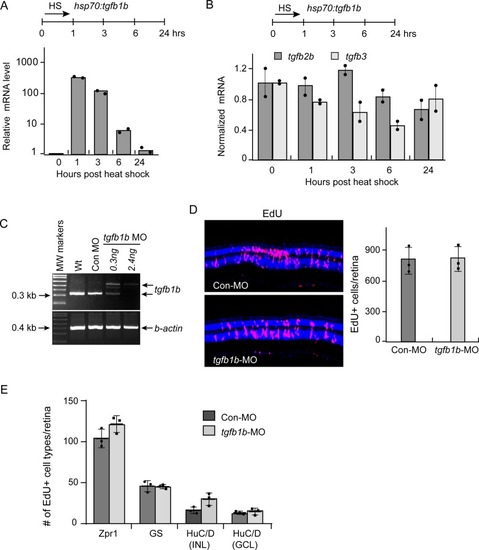
Heat shock induced tgfb1b gene expression in hsp70:tgfb1b fish.(A) Top illustration is experimental time line. Bottom graph is qPCR quantification of tgfb1bgene expression. (B) Top illustration is experimental time line. Bottom graph is qPCR analysis of the effect of Tgfb1b expression on tgfb2b and tgfb3 expression. (C) tgfb1b-targeting MO affects splicing of the primary tgfb1b transcript as indicated by the larger PCR fragment identified when embryos were injected with tgfb1b-targeting MO. (D) EdU click-it chemistry was used to identify proliferating MG at four dpi in retinas +/- MO mediated Tgfb1b knockdown. Left panels are representative images and right panel is quantification of data in (D). (E) Quantification of EdU-based lineage tracing of MG-derived progenitors that were labelled with EdU at four dpi and assayed for cell type specific marker at 14 dpi. Zpr1 detects cone photoreceptors; GS detects MG, HuC/D detects amacrine cells in INL and ganglion cells in GCL. |
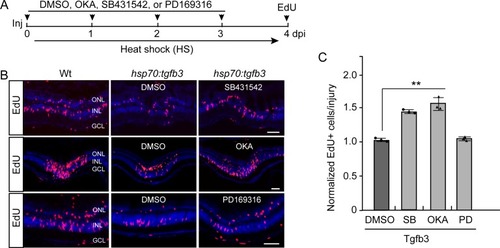
Alk5 and PP2A inhibition rescues Tgfb3-mediated inhibition of MG proliferation in the injured retina.(A) Experimental time line. (B) Edu click chemistry identifies proliferating MG in retinal sections from injured Wt and hsp70:tgfb3 transgenic fish treated with heat shock, +/- okadaic acid (OKA), PD169316 (PD), or SB431542 (SB) treatment. Scale bar is 50 microns. (C) Quantification of the effects of OKA, PD, and SB on Tgfb3-mediated suppression of MG proliferation that is shown in (B). Edu values are normalized to MG proliferation in Tgfb3 overexpressing transgenic fish. Error bars are SD. **p<0.01. PHENOTYPE:
|
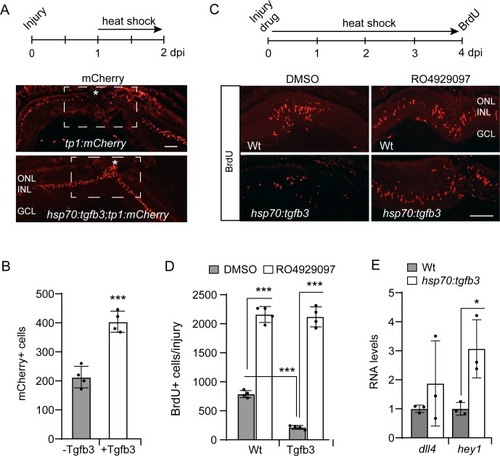
Tgfb3 acts upstream of Notch signaling to inhibit MG proliferation.(A) Top illustration is experimental time line. Bottom panels show mCherry immunofluorescence on retinal sections from either injured tp1:mCherry or hsp70:tgfb3;tp1:mCherry transgenic fish. Asterisk and box region shows the injury site. Note forced Tgfb3 expression stimulate mCherry expression. (B) Quantification of data mCherry+ cells shown in (A). (C) Top is experimental time line. Bottom panels show BrdU immunofluorescence on retinal sections from injured and heat shock-treated Wt and hsp70:tgfb3 fish treated +/- RO4929097. (D) Quantification of data in (C). (E) qPCR analysis of dll4 and hey1 RNA expression using total retinal RNA from Wt and hsp70:tgfb3 fish that were given a 1 hr heat shock (HS) treatment before sacrifice. Values are normalized to Wt control. Error bars are SD. *p<0.05, ***p<0.001. Scale bar is 50 microns. |