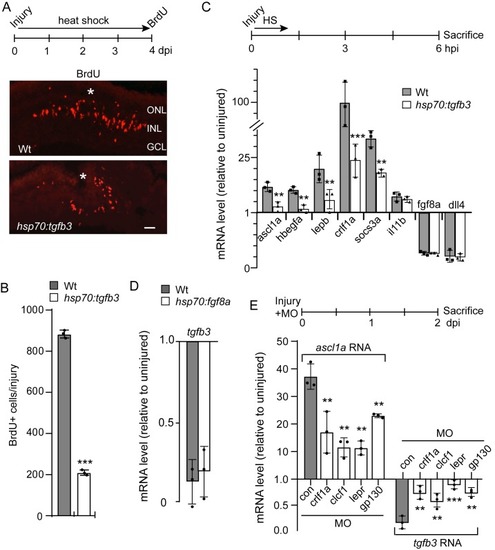
(A) Top illustration is experimental time line. Bottom panels are BrdU immunofluorescence in injured and heat shock-treated Wt and hsp70:tgfb3 transgenic fish. Asterisk marks injury site. Scale bar is 50 microns. (B) Quantification of data in (A). (C) Top illustration is experimental time line. Fish received a needle poke injury and a 1 hr heat shock and then sacrificed at 6 hpi for RNA analysis by qPCR. Bottom graph is qPCR quantification of select reprogramming gene expression levels in the indicated fish lines at 6 hpi. (D) Experimental time line is as in (C) and tgfb3 levels were assayed in the indicated fish lines at 6 hpi. (E) Top illustration is experimental time line. Bottom panel is qPCR analysis of ascl1a and tgfb3 gene expression with and without the indicated MO treatment. MO, is morpholino-modified antisense oligonucleotide used to knockdown expression from the indicated gene. Error bars are SD. *p<0.05, **p<0.01, ***p<0.001.