
|
Figure 2
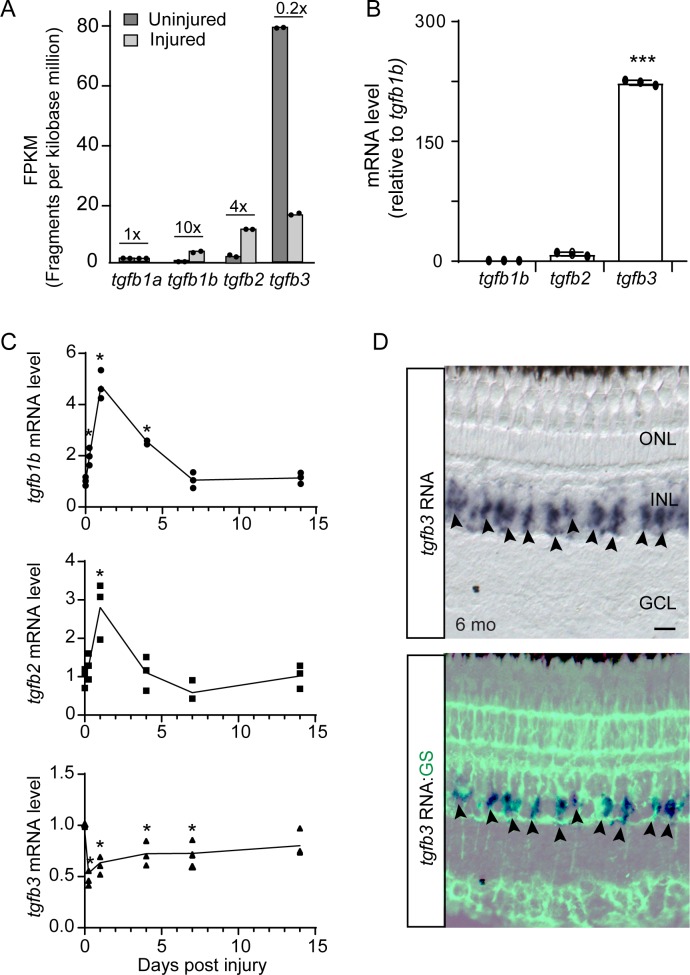
Injury-dependent regulation of tgfb gene expression.
(A) RNAseq was used to quantify tgfb gene expression in FACS purified GFP+ MG isolated from uninjured and injured (2 dpi) gfap:GFP and 1016 tuba1a:GFP fish retinas, respectively. Fold change in gene expression following retinal injury is indicated above the bars. (B) qPCR quantification of tgfb gene expression in GFP+ MG FACS purified from uninjured gfap:GFP fish retina (normalized to tgfb1b). (C) qPCR quantification of tgfb gene expression following retinal injury normalized to uninjured levels. Total retinal RNA was used for qPCR. Error bars are SD. *p<0.05. (D) tgfb3 in situ hybridization and GS (glutamine synthetase) immunofluorescence in adult fish retina shows tgfb3 RNA is expressed in MG. Top panel is tgfb3 in situ hybridization; bottom panel is overlay of in situ hybridization and GS immunofluorescence. Arrowheads point to tgfb3-expressing MG. Scale bar is 50 microns. *p<0.05, ***p<0.001.