
- Title
-
Inhibition of Notch signaling rescues cardiovascular development in Kabuki Syndrome
- Authors
- Serrano, M.L.A., Demarest, B.L., Tone-Pah-Hote, T., Tristani-Firouzi, M., Yost, H.J.
- Source
- Full text @ PLoS Biol.
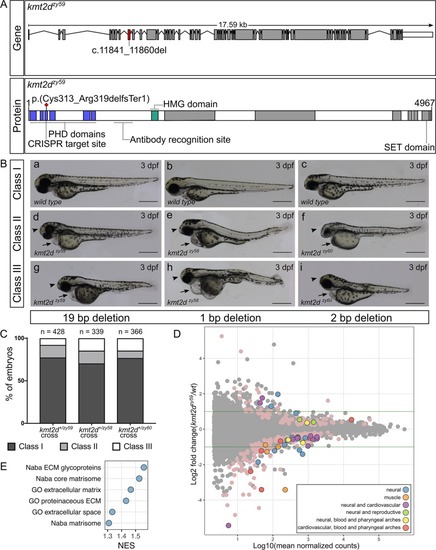
(A) Schematic of zebrafish PHENOTYPE:
|
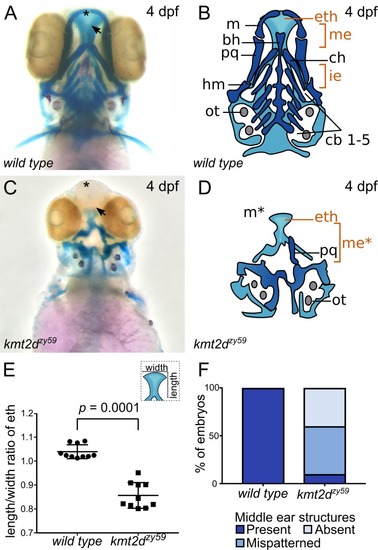
(A-D) Alcian Blue/Alizarin Red staining of cartilage and bone showing zebrafish homologous structures for mammalian palate (neurocranium) and middle ear (jaw structures). Ventral view of zebrafish sibling control (A) and PHENOTYPE:
|
(A) Confocal images of whole mount immunofluorescence for |
(A-B) Ventral view of vasculature in PHENOTYPE:
|
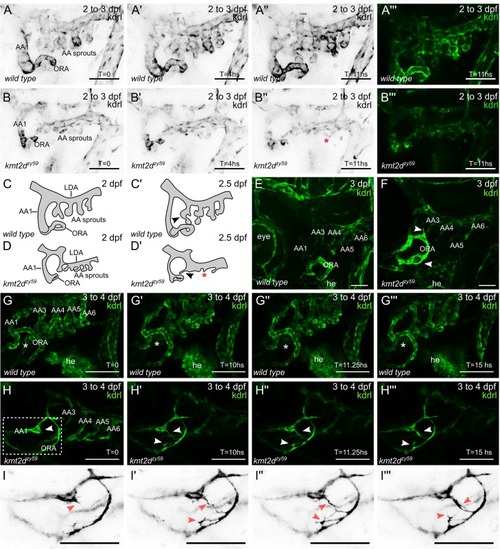
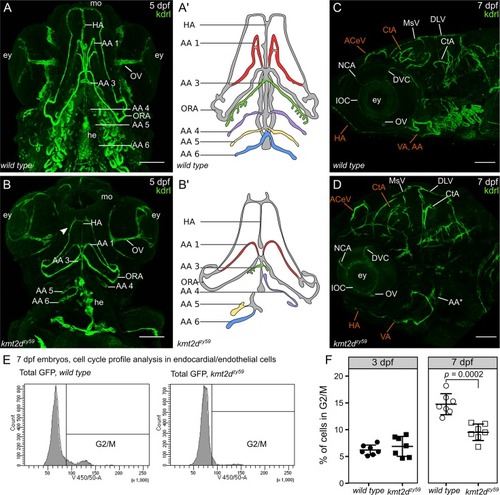
(A–B) Still images (MIP) from time-lapse live imaging performed from 2 dpf to 3 dpf. Cranial-lateral view at the level of AA development from PHENOTYPE:
|
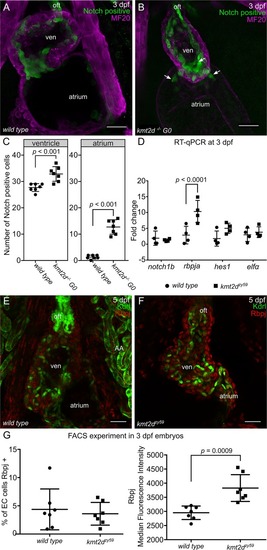
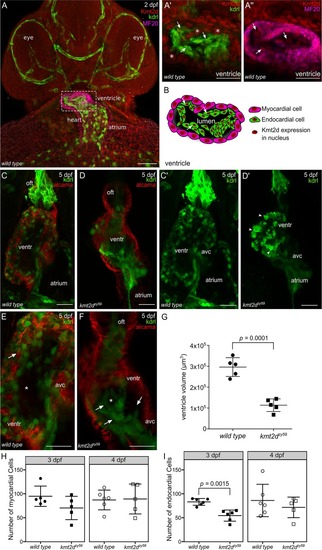
(A-B) Confocal images of the heart of EXPRESSION / LABELING:
PHENOTYPE:
|
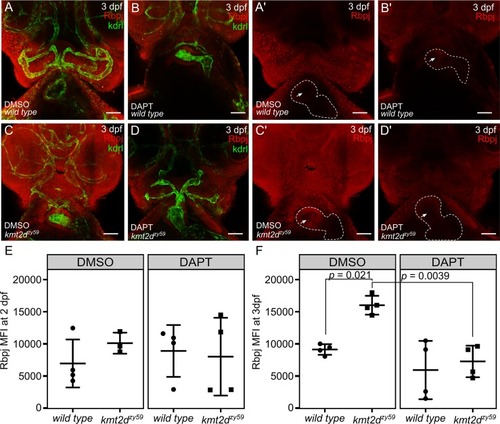
(A-D) Confocal images of |
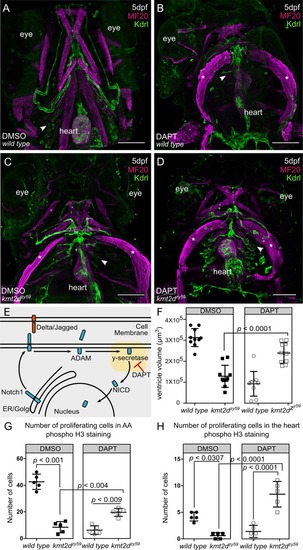
(A–D) Confocal images of EXPRESSION / LABELING:
PHENOTYPE:
|
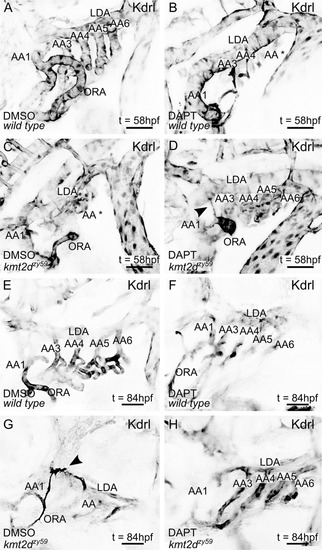
(A–H) Still images (MIP) from time-lapse live imaging performed from 2 dpf to 2.5 dpf (A–D) and 3 dpf to 3.5 dpf (E–H). PHENOTYPE:
|
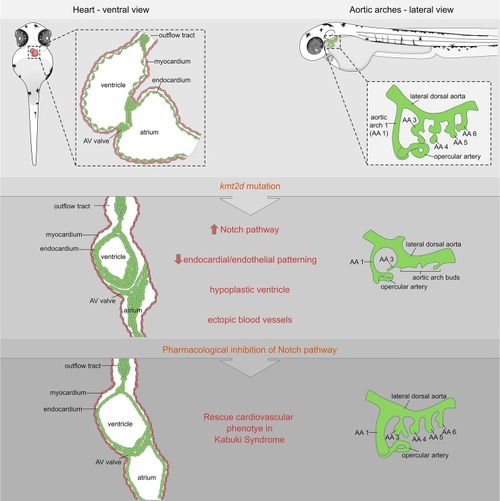
Schematic cartoon highlighting cardiovascular defects in our genetic zebrafish model for Kabuki Syndrome. Notch signaling is identified as primary candidate pathway underlying the endothelial/endocardial phenotype. Pharmacological inhibition of Notch signaling was able to rescue the cardiovascular phenotype in KS mutants. AA, aortic arch; AV, atrioventricular. |